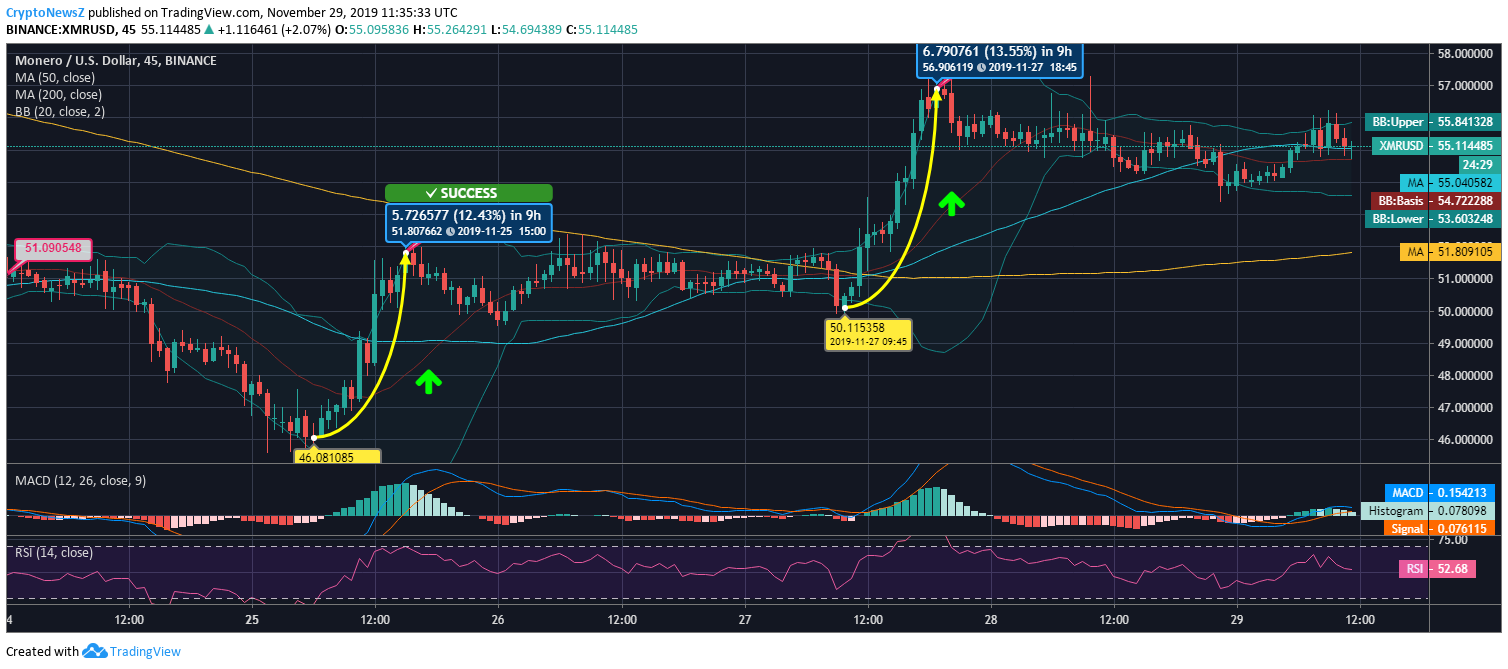
- The 5-day chart of Monero manifests two major price rises; price remains above $55
- Bollinger bands are heading towards volatility; $50 and $46 pose as support levels
- Though technical indicators look positive including SMA lines, the XMR coin is bearing selling pressure
Advertisement
Monero price has shown major improvement over the last five days, and the coin is currently eyeing the $60 price mark. XMR’s price moves are largely resonating with that of Bitcoin’s, as BTC also has traced an uptrend over the last five days.
XMR coin has continued its price escalation for the last five days as the price has been increased from $51.09 to $55.11. On November 24, the coin was pretty bearish and had a low swing at $46.08. Seeing a support level there, Monero has surged by more than 12% to reach above $51.80. The coin consolidated for more than a day before striking another price rise. With an increase of 13.55%, the coin has hit the price mark of $56.90.
Since the surge, the XMR coin price has been consolidating with a positive outlook except for a low swing at $53.55. The coin is trading at $55.11 at 11:35:33 UTC.
XMR/USD Price Chart

As the short-term SMA line is above the long-term SMA line, it paints a bullish picture for the coin at the moment. MACD and RSI are in the bullish zone as RSI is just above 50, and the MACD line is on the upside. The Bollinger Bands are stepping towards a volatile phase so, it is to be seen where the coin heads.
As per our experts’ predictions for Monero, the coin price is likely to face resistance at $56.18, $58.34, and $59.53 and support levels at $52.83, $51.64, and $49.48. Visit here our price prediction pages to know more about Monero price forecast for upcoming years.


