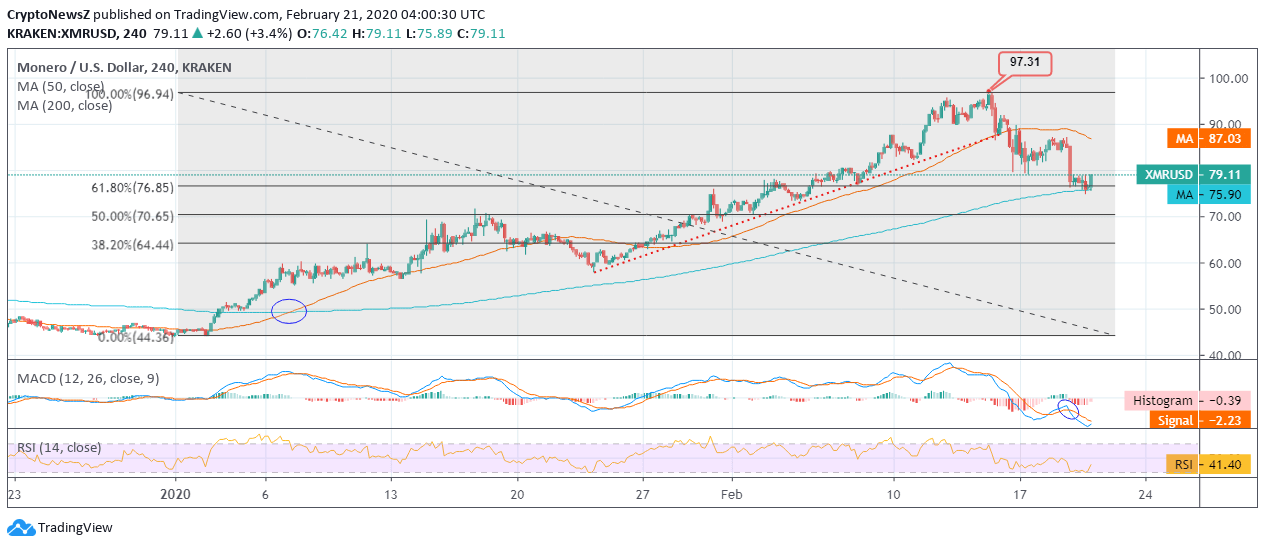
- Monero, at the time of penning down, was seen accumulating around the trading price of $79.11 with immediate support from 200-day MA at $75
- With steady support from 200-day MA, $74 to $75 is marked as a stop loss and while the coin oscillates above $80, $81 to $84 is marked as TP (Take Profit)
- XMR/USD experienced a “golden crossover” on a 4-hourly chart in the first week of January 2020, and since then it was experiencing a rising trend until the price fell towards 61.80% Fib Retracement level
- The 50-day MA curves downwards as the price consistently dipped below $80
Monero coin halts the rising trend after hitting a 90-day high at $97.31 and successfully breaking the resistance at $75.
Monero Price Analysis

Advertisement
Taking a glance at 4-hourly XMR/USD movement on Kraken, we see that the coin has experienced an incalculable pullback after mounting at $97.31. This has led the price trend of Monero to hit around 61.80% Fib Retracement level after the downward correction faced. The intraday movement took the candlestick of XMR coin below the 200-day daily moving average. This unforeseeable trend correction lacked steady support from 50-day MA as the price nosedived. The short-term face slight selling pressure until the coin makes a positive intraday move. To know more about Monero price prediction, clicking here.
Technical Indicators
The MACD of Monero is holding a bearish divergence yet appears to have a crossover above the signal line as the coin projects about intraday recovery above the 200-day MA support zone.
Advertisement
Similarly, the RSI of XMR coin is at 41.40 and is seen rising from the support at 30.


