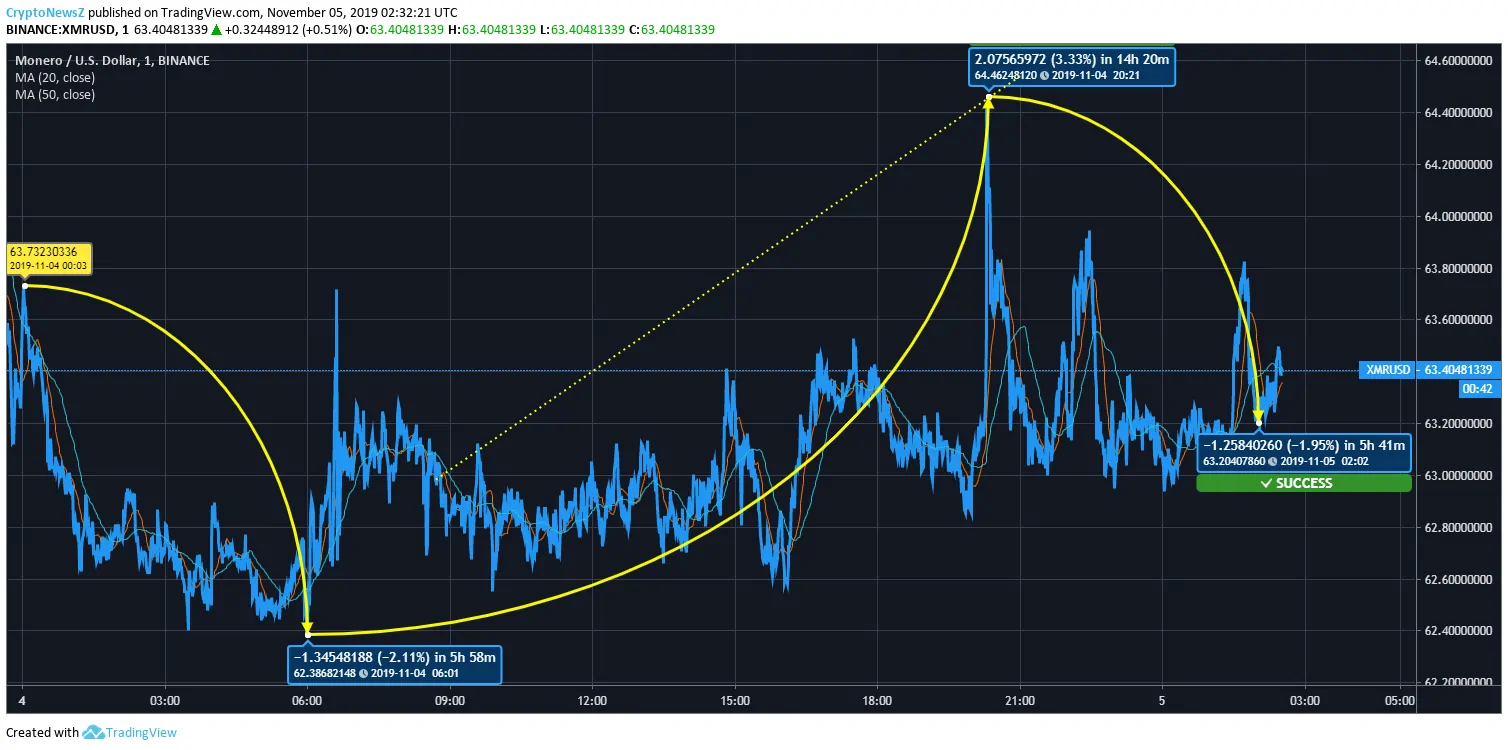
Monero is yet to show any signs of strength, and like all other past days, the last day also could not fetch any growth. With the three major price swings in these hours, the price of XMR coin against USD has now been down by 0.51%.
Monero Price Analysis:
Monero’s first swing started at 00:03 UTC, and over the next 6 hours, it fell to 62.38 USD from 63.73 USD by 2.11% decline in the price. At 06:01 UTC, XMR coin started showing signs of strength and rose as high as 64.46 USD with the help of a 3.33% increment in the 14 hours and 20 minutes. The last variation happened between 20:21 UTC and 02:02 UTC, and in these 5 hours and 41 minutes, XMR coin price fell by 1.95% to reach 63.20 USD.

Advertisement
Over the last seven days, XMR’s price trend has been full of volatile fluctuations, and the highest point it touched was at 65 USD, and it also touched 57 USD in these seven days.
Advertisement
Monero’s 20 days average is now at 58.4068 USD and its 50 days average stands at 59.4619 USD. The current price at 63.4048 USD is 6.63% and 8.55% more than the 50 days and 20 days moving averages, respectively. To keep yourself updated about upcoming Monero price value visit our Monero future.
| Monero (XMR) | Resistance and Support Levels |
| 1st Resistance | $63.3466 |
| 2nd Resistance | $64.1533 |
| 3rd Resistance | $64.5566 |
| 1st Support | $62.1366 |
| 2nd Support | $61.7333 |
| 3rd Support | $60.9266 |


