This content has been archived. It may no longer be relevant.
Litecoin (LTC) is an open-source peer to peer cryptocurrency like Bitcoin. Crypto community usually refers to it as Silver (Bitcoin being Gold). Litecoin was made as an alternative to Bitcoin network for faster and cheaper transactions. Current Market Cap of Litecoin is 3.5 Billion, and it is one of the Top 10 Altcoin, currently ranking in number 6 spot.
Litecoin Price Prediction
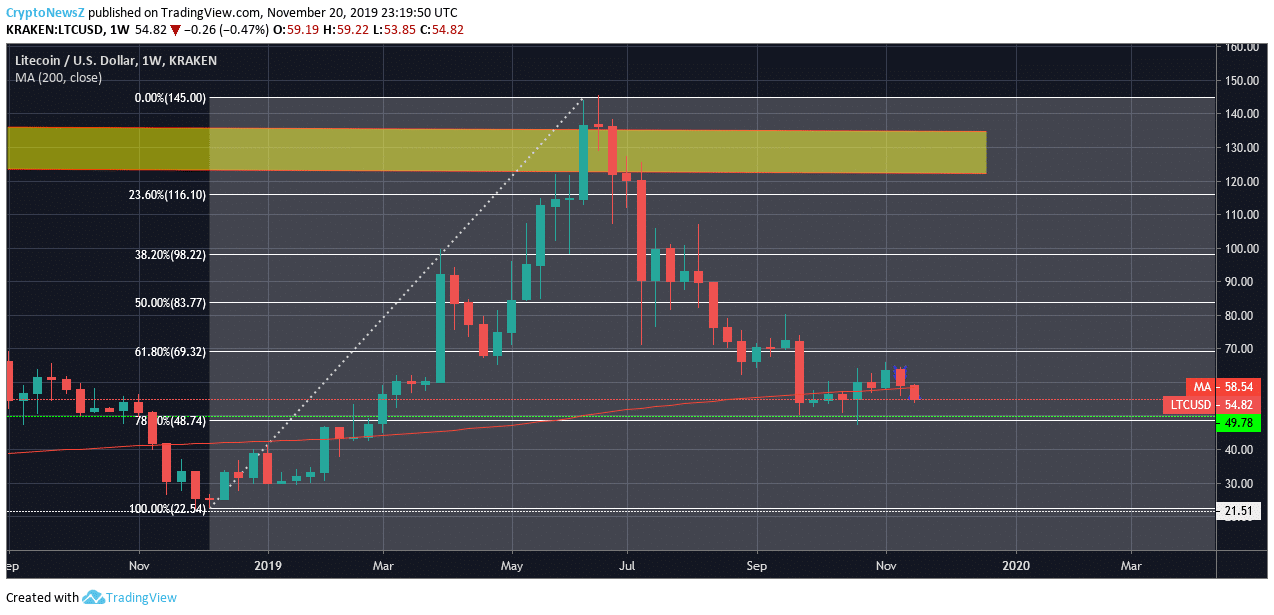
LTC prices are back to the weekly key support around $48 (green dotted line) and critical support being $21.51 (white dotted line). Currently, the weekly candle is going below 200 days SMA (solid red line) towards the key support level. Read more about Litecoin price prediction by CryptoNewsZ to get more information about future price prediction to enhance your knowledge about the same.

Litecoin prices had earlier bounced from 78.6% Fib level, which corresponds to $48.74, and this level also coincides with the weekly key support. LTC needs to reclaim its previous support now resistance at 61.8% Fib, which is $69.32 for the confirmation of reversal.
Advertisement
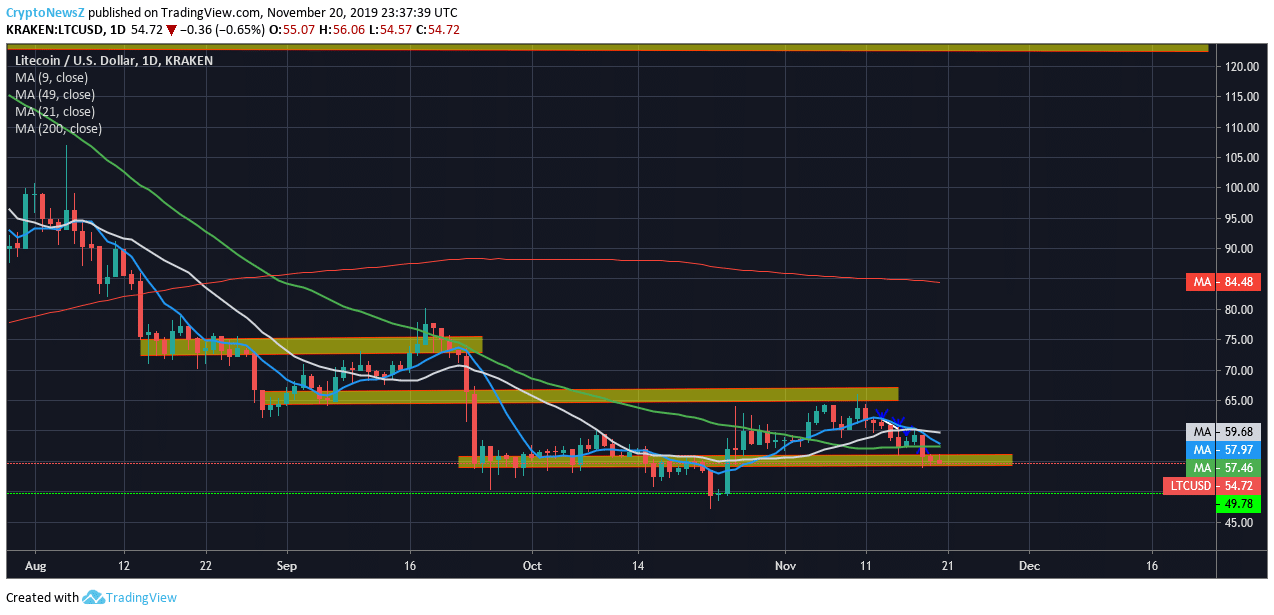
1 Day LTC/USD price is currently testing its daily support level around $55 after being rejected earlier, around $65.34. Since prices fell below 9 days SMA (Simple Moving Average: solid blue line), 21 days SMA (solid white line) and 49 day SMA (green solid line), daily support might not be able to hold the price around $55 and it may push down towards the weekly support at $49.78 which also coincides with the 78.6% Fib level.
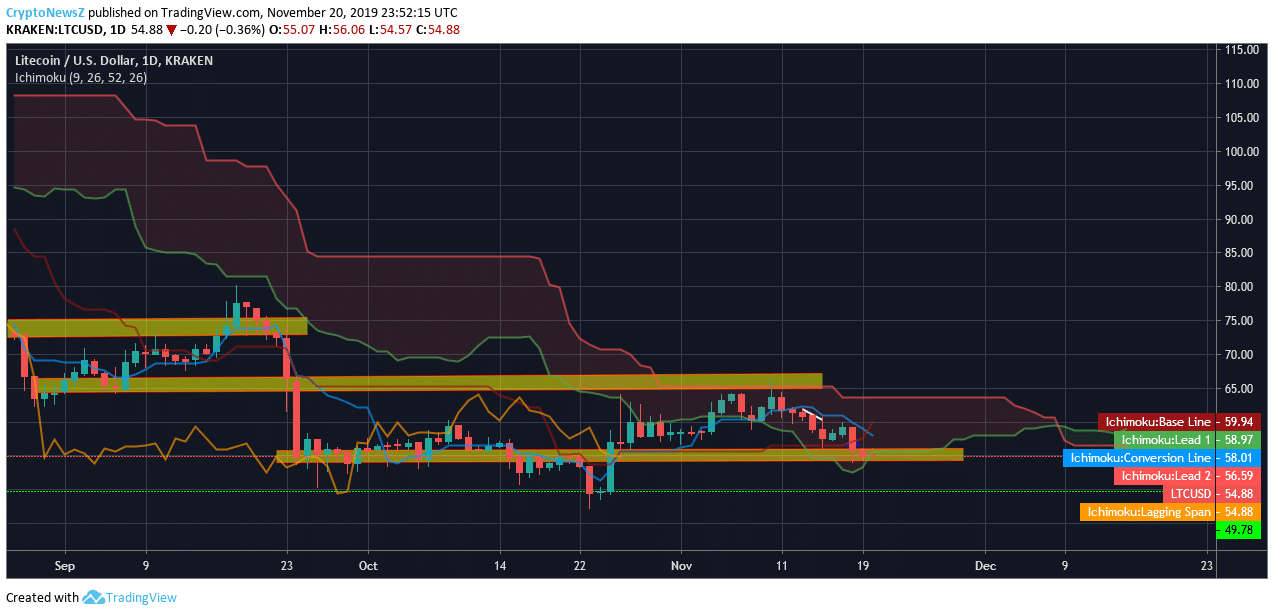
Ichimoku Kinko Hyo: Senkou Span A is acting as the support at $55, which also coincides with the daily support level (yellow area), prices earlier got rejected by Senkou Span B at $65.34 which also coincides with the resistance zone (yellow area). Prices are inside the Kumo, and under the Tenkan Sen (blue line) and Kijun Sen (red line) thus, it is a no-trade zone, and it would be a wise decision to wait and see a clear reversal signal.
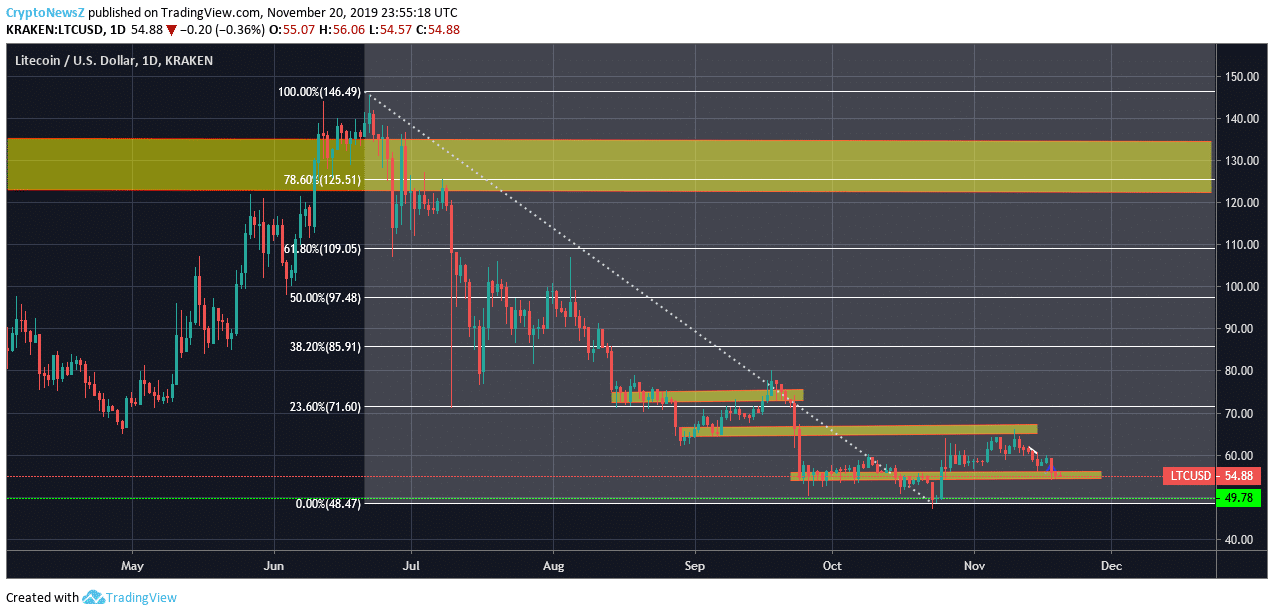
Laying a Fibonacci tool over the previous 1 Day Chart Time Frame gives some interesting insights as follow:
- Litecoin Price is in a downtrend, but it respected the important Fib levels.
- 8%, 38.2% and 23.60% Fib levels which corresponds to $109.5, $85.91 and $71.60 respectively.
- If LTC bounces from the current price of $54.88, $71.60, $85.91, and $109.5 will act as resistance; thus, it can be used as TP (Take Profit) area respectively.
RSI (Relative Strength Index) approaching oversold area, earlier when prices hit these levels, it had a shift in momentum thus and had a price reversal.
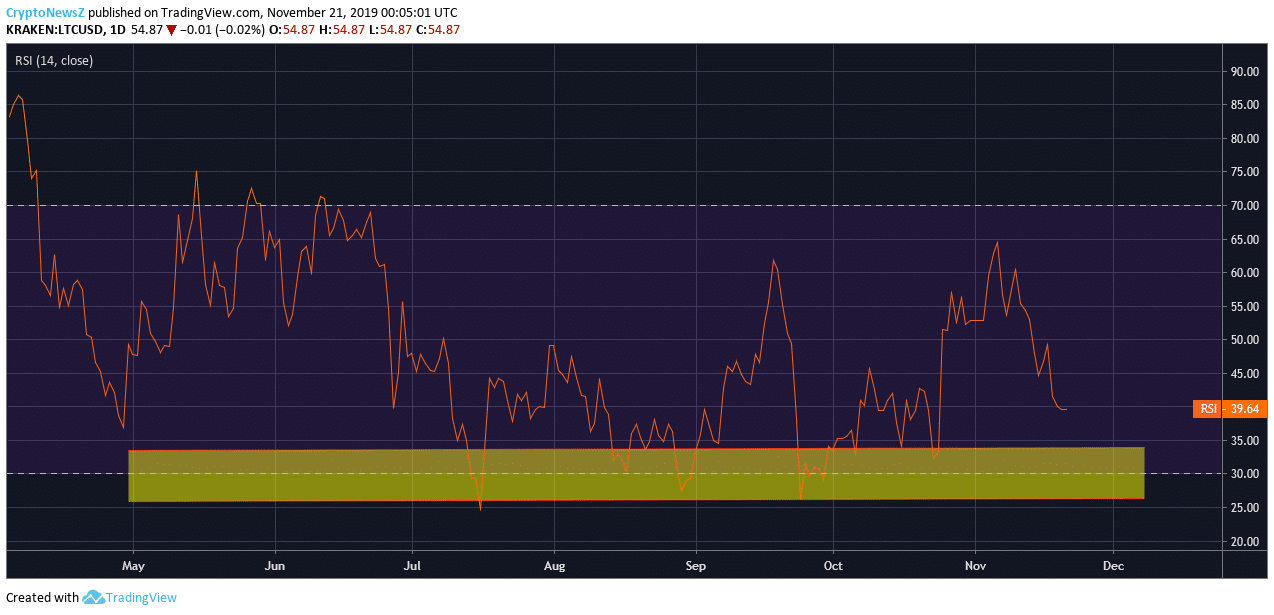
Stoch RSI (Stochastic Relative Strength Index) is in the oversold area thus, indicating a reversal in momentum.

Advertisement
Conclusion: LTC price is near weekly key support area, and Technical Indicators like RSI is approaching oversold area while Stoch RSI indicating that it is oversold, LTC price may bounce, and one can see a relief rally towards important Fib levels which earlier acted as support. But, if $Bitcoin price goes to $8000 or lower, then expect the LTC price to fall below the current level of $54.88 towards $49.78 or lower.


