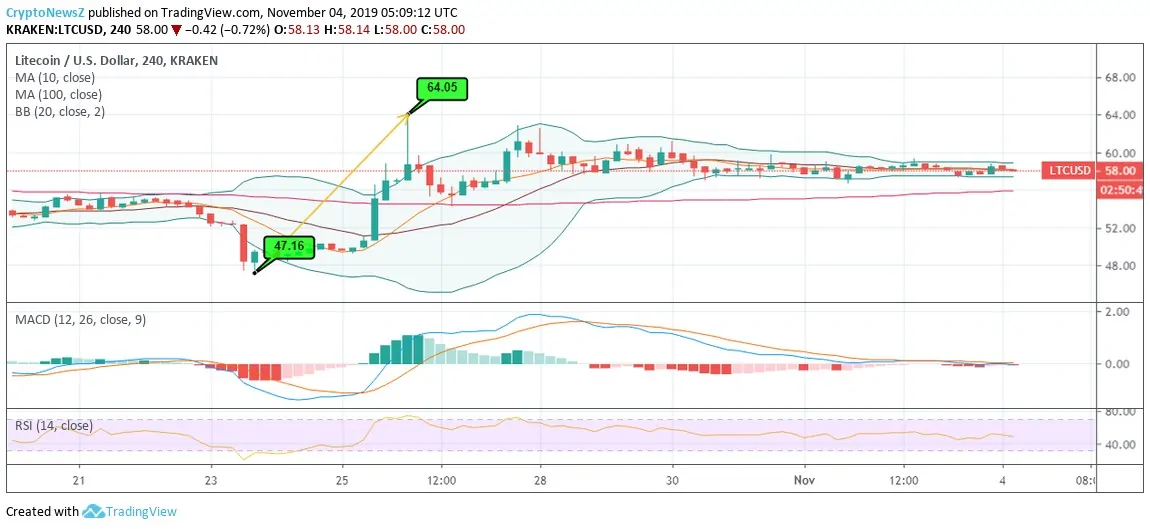
Litecoin trades below $60 since the last week of the previous month, i.e., around October 29, 2019. With this, LTC price gives out the 7-day high at $60.89 and simultaneously 7-day low at $57.60. However, if we take into consideration the 15-day price movement of the coin, we see that Litecoin has been traded as low as $47.16 and as high as $64.05 since October 20, 2019, till date.
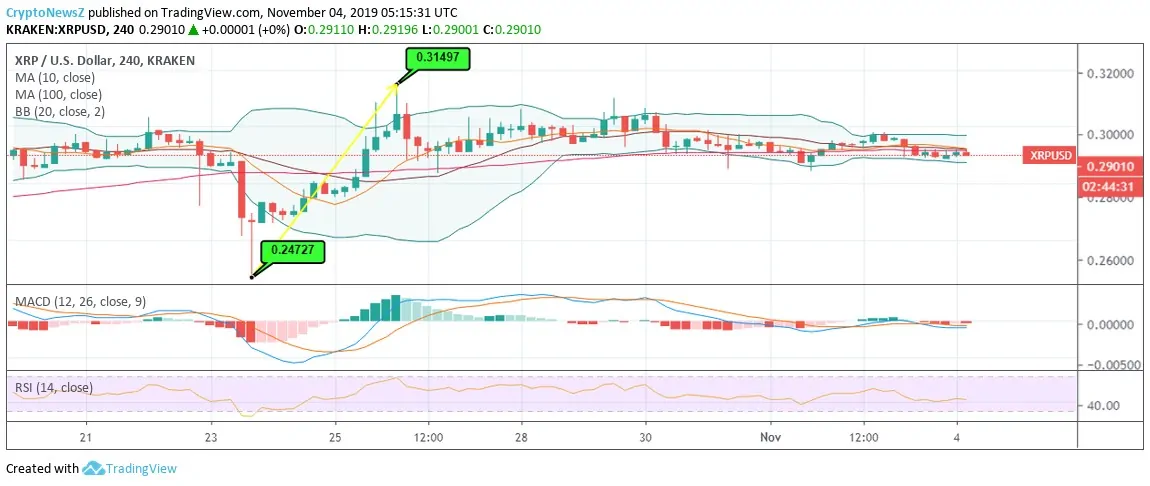
XRP, when compared with Litecoin, has shown us quite a stable movement throughout. XRP has been continuously trading on and below $0.30 since October 27, 2019, until the time of writing, today. However, within the past 15 days, the coin has been traded above $0.30 only once, i.e. on October 26, 2019, at $0.310. And for the rest of the days until October 20, 2019, Ripple has been traded as low as $0.247 within the said time frame.
Litecoin vs. Ripple Price Analysis:

Litecoin, at the time of writing, was trading at $58 as on November 04, 2019 as per the data feed from Kraken.
The 4-hourly movement of LTC/USD has been stable to a major extent within the past 15 days.
However, the 20 days Bollinger Bands are seen to be narrowing at present. Therefore, we foresee a lower level of volatility in days to come, and the breakout seems to take an upper direction soon, as observed from the current movement.
There have been a couple of events when the investors could have planned a long entry to trade LTC when the price broke out the upper band. Similarly, the price even broke out the lower band exhibiting a ‘sell’ signal when the price of the coin was as low as $47.16.
The coin shows a growth of over 35% when LTC price soared up to $64.05 from $47.16 in the last week of the previous month. This shows a remarkable growth but currently trades 9.44% lower and 22.9% higher than the respective high and low of the said time frame.

Advertisement
When compared, Ripple price has also shown a growth of over 27% in the same time frame as LTC ranging from $0.247 to $0.314.
Currently, the 20-day Bollinger bands for XRP also seem to be narrowed as the price has been moving stably.
Here, the price of XRP has crossed the lower bands comparatively more, which indicates a ‘sell’ signal as the closing price fell lower than the opening price. The current trading price is 7.64% lower and 17.40% more than the respective high and low of the said duration.
Technical Indicators—Litecoin:
The 100-day MA for LTC falls below the lower Bolling Band, while the price remains adjacent to the average within the bands.
The MACD of the coin remains inclined to zero with the signal line and MACD line having a joint movement.
The RSI of the coin is above 40, showing no extremities of being overbought or oversold, at present. However, check on LTC Forecast, to understand the scenario of upcoming years.
Technical Indicators—Ripple:
The 100-day MA, 10-day MA, and the average within move simultaneously. Important to note that the 100-day MA, unlike LTC, is within the range of 20-day Bollinger Bands.
However, the current trading price is slightly below the said moving averages.
Advertisement
The MACD of the coin also lies slightly below zero and has an adjacent move with the signal line with a slightly bullish outlook.
The RSI of the coin is slightly above 40, showing no extremities of being overbought or oversold, at present.


