- Litecoin loses 2.28% in the last 24 hours and gets below 75 USD for the third day.
- It is likely to touch 138 USD, its YTD high before this year ends.
Advertisement
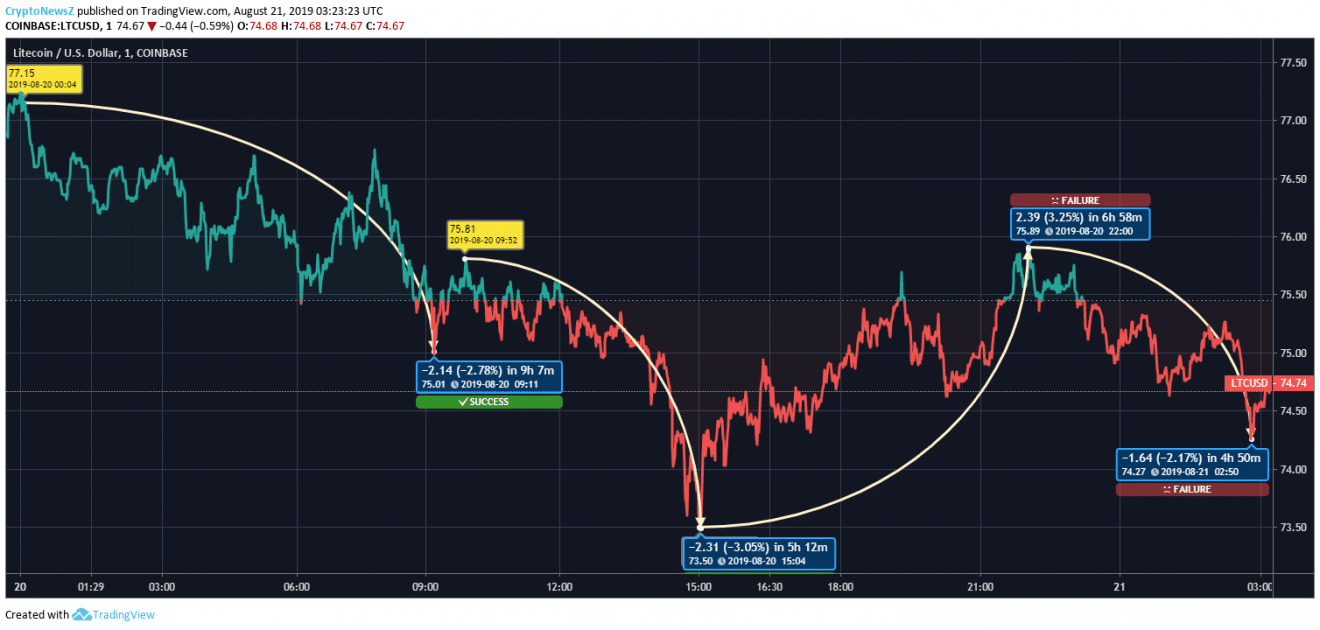
Litecoin loses 2.28% over the last 24 hours, and it is yet to get over from 75 USD price mark. The coin has shown four major price variations over the last 24 hours. It has touched the lowest point of the day at 73 USD in this period. Here is an analysis of the four price swings of the coin. Let us find out the current details of the coin now.
Litecoin Price Statistics-
| Litecoin (LTC) | 21st August 03:23 UTC |
| Rank | 5th |
| ROI (Return on Investment) | 1,639.54% |
| Coin Circulation | 63,078,387 LTC |
| Market Cap | 4,716,075,315 USD |
| Value in USD | 74.74 USD |
| Value in BTC | 0.00703284 BTC |
| 24h Volume | 2,627,910,145 USD |
LTC to USD Price Comparison-

Advertisement
Litecoin was being traded near 77 USD at the opening of yesterday. Soon the coin fell by 2.78% and reached 75 USD by 09:11 UTC. The second swing also came as a fall of 3.05%, and it made the coin to lose 2.31 USD and pushed the value against USD to 73.50 USD, the lowest of the day. It was, however, followed by a hike of 2.39 USD, and it made the investors rich by 3.25% by 22:00 UTC. The last swing happened between 22:00 UTC and 02:50 UTC, and it cost the coin 1.64 USD and made the coin to roam around 74 USD again.
LTC Price Prediction-
Litecoin a few days ago was racing towards 100 USD and after a few blows, it is now stagnant at 75 USD. It should be noted that the YTD high lies at 138 USD and as per LTC Predictions, the coin has huge potential to have a bullish run and even breach the YTD high before 2019 ends. The next probable resistance and support levels are listed below.
| Litecoin (LTC) | |
| 1st Resistance | 77.11333333 USD |
| 2nd Resistance | 79.02666667 USD |
| 3rd Resistance | 80.61333333 USD |
| 1st Support Level | 73.61333333 USD |
| 2nd Support Level | 72.02666667 USD |
| 3rd Support Level | 70.11333333 USD |


