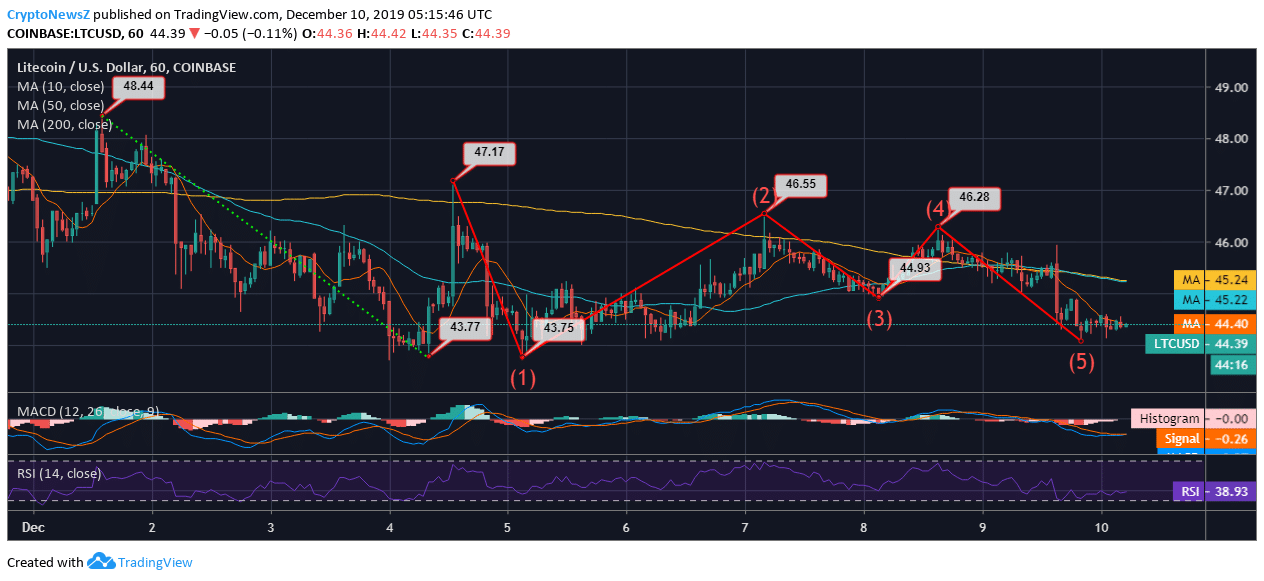
- Litecoin trades at $44.39 and holds selling pressure as it has no support from the short-term moving averages
- LTC hits the double bottom around $43 price area in the past ten days
- The Elliot Waves like the pattern has led the coin to hit at $44 from trading at $48.44, initially in the ongoing month
Advertisement
Litecoin was soaring at $48.44 at the first trading day of the month, immediately after which it went on a downward stride until it hit bottom at $43. Later, an Elliot Wave like a pattern was witnessed by LTC/USD price trend forming a falling wedge as it slid from $47.17 to currently trading with regression of over 5% at $44.39.
Litecoin Price Prediction

Analyzing the Litecoin to USD price movement on Coinbase, we see the declining trend with a half-done falling wedge formed in the past five-day trading duration. The bottom price in the said duration was hit at $43.7, and the current trading price of Litecoin is merely 1.57% more than the same. However, there is no grounded support formed around the current trading price and is surrounded by dense selling pressure with awaiting support at 5-day EMA.
The 50-day and 200-day MA are moving together above the current trading price, around $45.2 price area. The bearish impact is present as the LTC coin is hitting the descending leg of the Elliot Wave formed.
The same is confirmed by the MACD of Litecoin as it runs bearishly below zero, as the signal line and MACD line move jointly and adjacently.
The RSI of the coin is at 38.93, showing no extremities at present but holding a strong inclination towards the oversold region. As per the current trend and our Litecoin prediction, we assume that the coin might continue to trade with the downtrend and retest its previous support.


