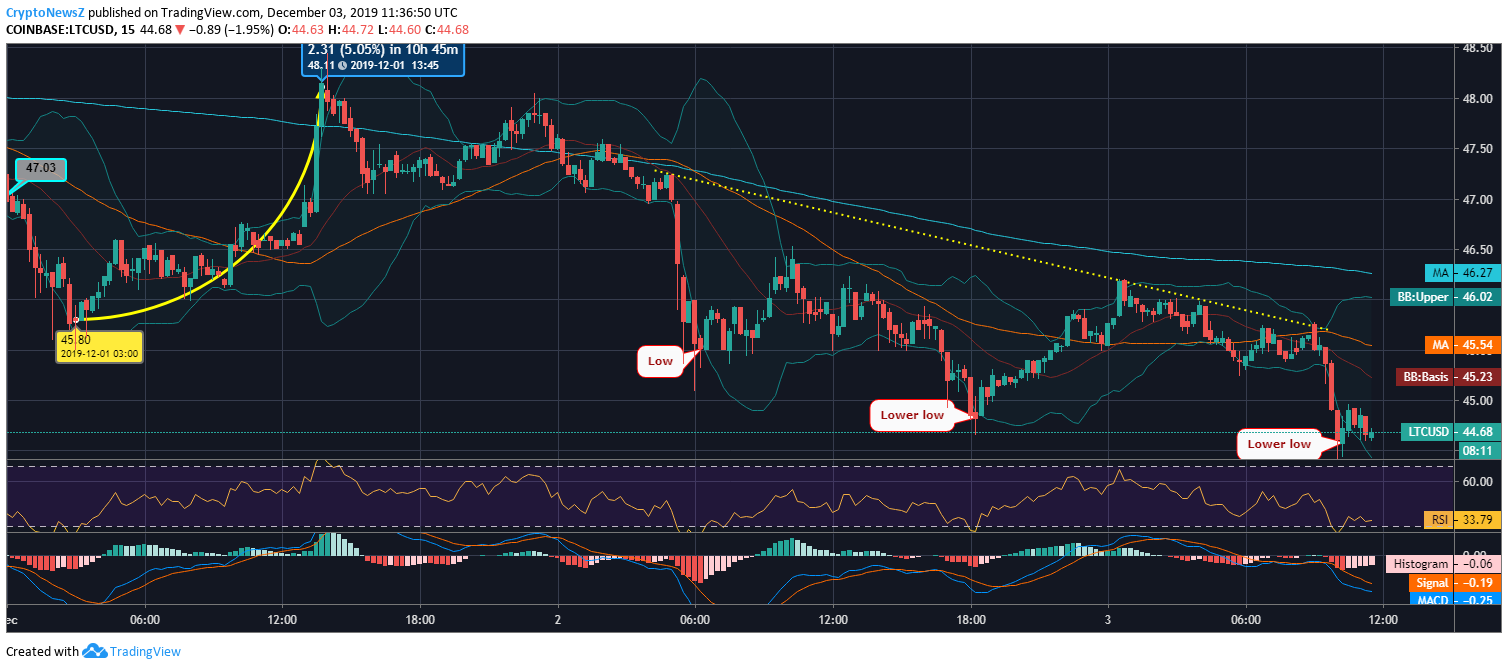
- Litecoin is forming lower lows; fails to catch a bullish momentum
- The bearish trend line is still intact as the coin is yet to find a decent support level
- The LTC coin has recently formed a bullish candle; currently below the major support level
- Litecoin is set to enter the volatile zone as Bollinger bands are moving away from each other
Advertisement
Despite Bitcoin’s mild price recovery, LTC has not stepped into the bullish spell as its price trend is still exploring lows. However, considering the current bearish nature of the crypto market, Litecoin’s struggle for recovery seems a bit obvious.
Litecoin Price Prediction
The day before yesterday, initially, the coin formed a low swing near $45 before surging above $48. Instead of heading towards $50, LTC faced rejection above $48.11 and pulled back to $47.16.
The more than 5% growth settled down as it kept consolidating there till it closed on the day. Yesterday’s price actions were bearish enough for the coin to form a lower low pattern near $44.85, indicating a negative sign. Litecoin weakly rebounded from there and reached above $46. Today, the coin is continuing the downtrend and is trading at $44.68 at 11:36:50 UTC.

LTC coin is set to enter a volatile phase, according to the Bollinger bands. The SMA lines are giving negative signs as the long-term SMA line is on the downside while RSI is nearing 30, indicating upcoming oversold momentum. Similarly, if you want to know more about the same, just go through our LTC Coin price prediction page and get more details about expected price fluctuations. Besides, here the MACD chart is in a bearish zone with its MACD line on the downside.
Litecoin is likely to see resistance levels at $47.31, $48.81, and $49.8 and support levels at $44.82, $43.83, and $42.33.


