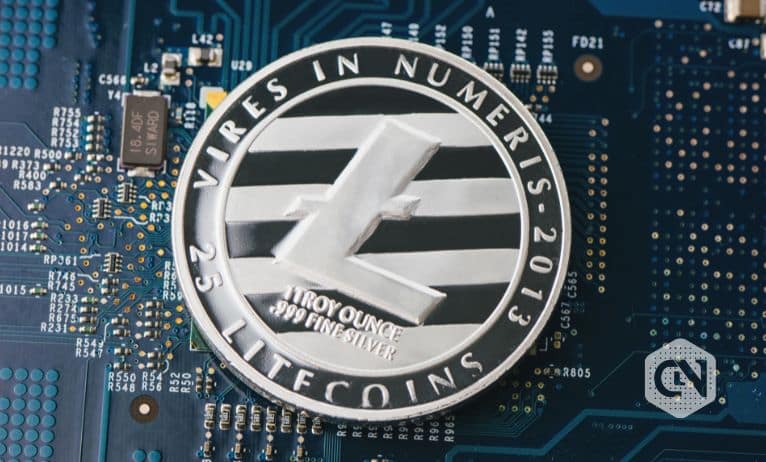
Litecoin has been one of the most trending and user-application blockchains sourced from the Bitcoin code. LTC carries a rich history of development and growth that has allowed it to rank amongst the market leaders of 2022.
Ranking at the 13th spot, LTC carries a relatively high market capitalization of $5.4 billion with 50% negative movement year on year basis but a positive result of 18% in the last thirty days. The buying sprees witnessed from the dip of 8th November have not only allowed Litecoin to retrace above the previous rejection but also enabled the token to jump 20% further ahead.
The positive growth of its usage in payments infrastructure across the globe turned it into the most successful cryptocurrency for point-of-sale and micro-transaction payments.
Litecoin (LTC) Price Analysis
Litecoin has maintained a rather bullish stance, even with crypto negativity troubling the market leaders. The current scenario showcases a wait-and-watch strategy being deployed at LTC, as the token has outperformed market expectations by a huge margin. The trend for LTC shows no stopping, but consistent buying requires motivation. A turnaround in the crypto market on broader terms can facilitate further growth to $100 and beyond.
Advertisement
Litecoin earlier faced rejection from the 200 EMA curve, which is an expected outcome of any token undertaking rally from under 100 EMA levels. The turning point for LTC price action was a single rally breakout of this revered moving average level. Since 23rd November 2022, the LTC token has been under consolidation, which is now extended to the third week.
As buyers have lost interest, a sudden drop in the RSI indicator is noticed, with the MACD indicator going forward to declare a bearish crossover that is seen as a sign of unsustainable movement. Transaction volumes from November have witnessed a major decline despite the rising value of the LTC token. $63 was established as an earlier support level, but the recent growth spree highlights the repeated support found at the $73 mark for Litecoin.
The current weekly candle shows a decline of 12% from its peak value, while on a closing basis, the decline has been limited to just 2%. Such a negative turnaround at this peak level was expected since the previous weekly candles ended with an upside wick being developed. To know the in-depth analysis of Litecoin’s future, visit our LTC price predictions.
The daily and weekly candlestick patterns showcase RSI to be in the vicinity of 55 to 60, bringing a strong upscaling potential with positive news. The MACD indicator shows no weakness in the weekly candlestick patterns.
Advertisement
Resistance remains unchecked at the $82 mark, with only two failed attempts made in the last three weeks on consolidation. LTC enthusiasts should maintain a systematic investment to ensure they don’t miss an uptrend rally.


