- Litecoin has traded below 45 USD amid the market pressure
- The medium-term outlook may get bullish with resistance around 46 USD
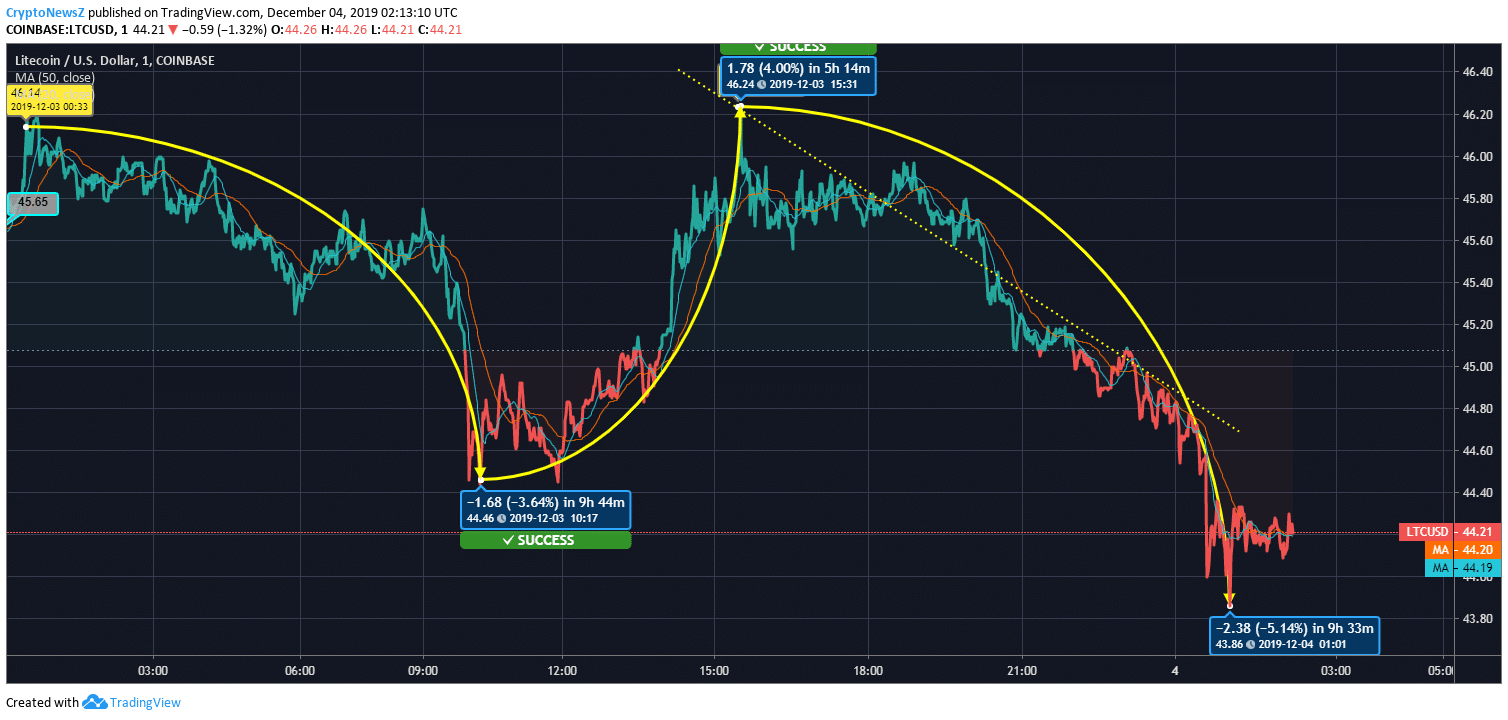
Litecoin has been down by 3.15% over the last 24 hours and the value has now gone as low as 44.21 USD. Over the last 24 hours, it has shown three major price variations and they are in the range of 46.14 USD and 43.86 USD.
Litecoin (LTC) Price Analysis:

Advertisement
Litecoin opened the day at 45.65 USD and the first variation happened between 00:33 UTC and 10:17 UTC and in these 9 hours and 44 minutes, it lost 1.68 USD and got placed at 44.46 USD. It was followed by a 4% price rise that added 1.78 USD to the LTC coin and placed it at 46.24 USD, the highest for the day. The last variation happened between 15:31 UTC and 01:01 UTC and this last variation cost 2.38 USD and brought it down to 43.86 USD.
Advertisement
The market cap of LTC on December 3, was 2.893 billion USD and over the last 24 hours, it has been down to 2.862 billion USD. It should be noted that LTC’s market cap is on a constant slope since the starting of December.
LTC’s 20 days average stands at 44.2 USD and its 50 days average is now at 44.19 USD. The current value of LTC stands at 44.21 USD that is 0.045% and 0.022% more than the 50 days average and 20 days average respectively. As per our LTC Price Prediction, the coin is definitely not in its worst phase but recovery doesn’t seem around the corner for sure. Investors are advised not to sway down by the selling pressure as the medium-term outlook seems bullish.
Resistance and Support levels:
| Litecoin (LTC) | |
| 1st Resistance | 46.41333333 USD |
| 2nd Resistance | 47.44666667 USD |
| 3rd Resistance | 48.27333333 USD |
| 1st Support Level | 44.55333333 USD |
| 2nd Support Level | 43.72666667 USD |
| 3rd Support Level | 42.69333333 USD |


