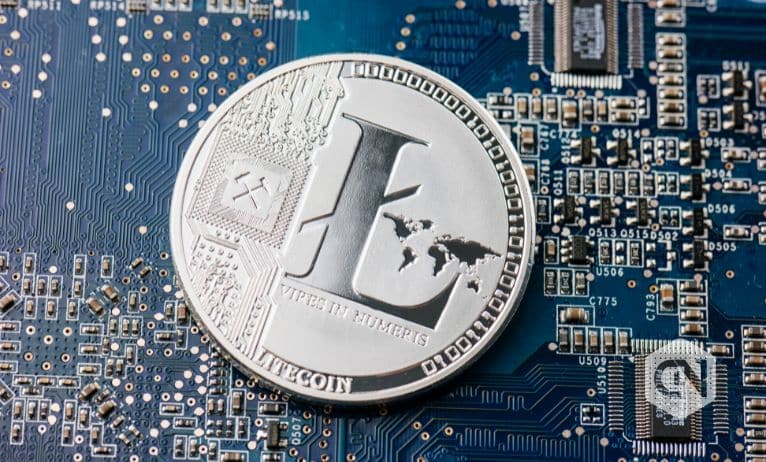
Litecoin is very similar to Bitcoin, which is mainly used for small transactions. LTC is the native coin and is currently in high demand. That is why it broke the previous resistance even after the fall of the FTX liquidity crisis. When many altcoins are forming yearly lows, LTC is trading close to $77, breaking the resistance of $65.
In the last seven months, Litecoin consolidated between $45 and $65. It observed an outflow in the first half of this year but was less affected by such global circumstances.
Daily candlesticks of LTC have broken the upper range of the Bollinger Bands, which means it will retrace to the previous resistance of around $70 for the short term.
Advertisement
Other technical indicators, such as MACD and RSI, are bullish that suggest a strong momentum. Should you invest for the long term? Read our Litecoin prediction to know.
After making an all-time high of $412.96, it is now trading around $77, which can be a bottom for the long term. It has been going upward in the last two weeks, and we can find a price surge even on the weekly chart. Candlesticks of LTC have broken the Bollinger Bands, which suggests a consolidation for the next few weeks.
In the third week of November, Litecoin formed a bullish engulfing candle that suggests an uptrend for the short term, but $77 is also a crucial level, and it is not an ideal time to invest for the long term.
Technical indicators such as RSI and MACD are bullish, suggesting it may go up to $90, but it will be a risky investment, at least for the short term. LTC price is still around the long-term support level, which is far below the all-time high, so it may break the support of $45 after two months.
Advertisement
It is not a time to assume the bullish market and invest blindly; you have to keep the cash in hand so that you can accumulate your favorite crypto assets when they provide the ideal opportunity at a lower price.


