This content has been archived. It may no longer be relevant.
- IOTA trades sluggishly, has shown no move above $0.26 today
- Yesterday before closing, IOTA had traced a close above $0.26, but faced rejection above it
- The coin is below its 5-day SMA, carrying selling pressure
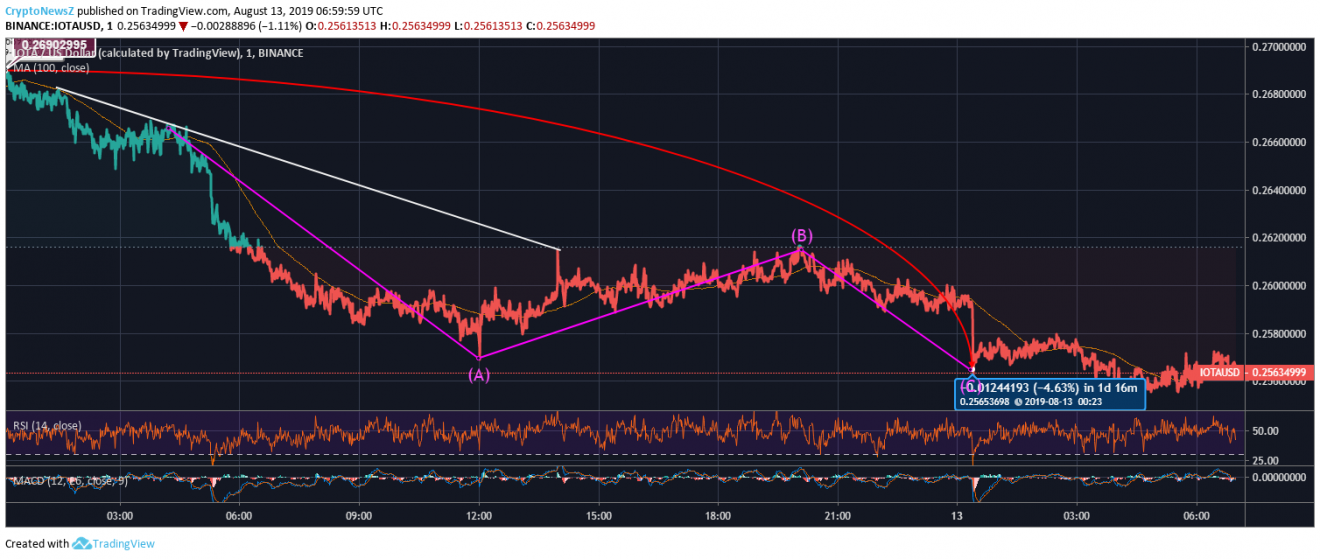
IOTA price was oscillating between $0.25 to $0.26 in the later part of yesterday. Investors were hoping a bullish price push today, but the coin has nosedived instead.
The IOTA price was above $0.26 and it remained above the mentioned price mark till 07:55 UTC. The coin then tumbled to $0.2586 hitting its lowest price point of yesterday. The coin then took a mild rebound as high as $0.2616 and then the price corrected back to its price range around $0.25.
Advertisement
Today morning the coin has sharply dropped further to $0.2565. Here, IOTA price has shown a decline of 4.63% from yesterday’s open price. At 06:59:59 UTC, the coin is trading at $0.2563 and over the last 24 hours, IOTA has decreased by 4.72%.
IOTA/USD Price Chart

IOTA’s current price is 30.39% lower than its 100-day SMA of $0.3682, which points out to the extreme bearish impact that the coin carries. IOTA price is trading with its price even below its 5-day SMA.
IOTA Price Prediction & Technical Indicators:
Advertisement
MACD chart for the IOTA price trend for a day is lowly volatile and is in bearish zone. While RSI for the coin is heading towards 30 indicating an upcoming oversold momentum. As per MIOTA Forecast, the IOTA coin may face resistance at $0.2666 and support at $0.2515.


