IOTA also known as the internet of things is a technology that enables transactions between devices on the internet of things (IoT). Verification known as Directed Acyclic Graph (DAG) verifies the previous transactions and then lets you perform the current transaction. The IOTA Tangle is a Directed Acyclic Graph which grows in conjunction with activity in the network; i.e., the more activity, the faster the network. It works on a quantum-proof protocol that reportedly brings benefits like ‘zero fees, infinite scalability, fast transactions, and secure data transfer.’
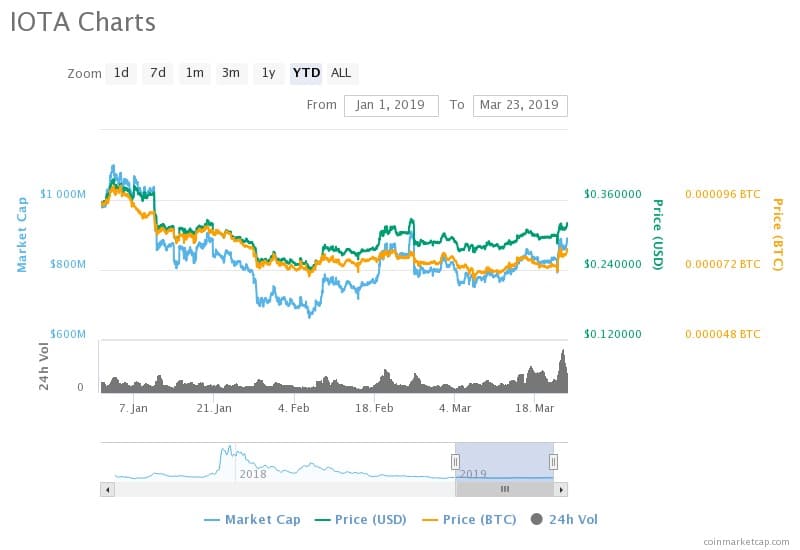
IOTA is the 14th largest cryptocurrency is the market, whose mcap value traded at $990 million in the opening market in January. The crypto coin’s value skyrocketed and crossed $1100 million between January 03 and 10. The market toppled and touched its lowest on February 06 with a value of USD 674,005,512. The downtrend period lasted between January 11 and February 08. Nevertheless, the Mcap values gradually increased and have been stable since then. It reached the peak value recently, of USD 910,708,058 on February 24 at 08:34, which is higher by 3.34% from the current value. The present value of IOTA as on March 23 at 15:54 UTC is $880,281,897 USD for the corresponding value of $17,620,866. The moving averages support the overall increase in the market trend. The 20-day EMA exhibits a distinct uptrend with the value increase from USD 801,831,983 on March 03 to the current value by 9.78%. Similarly, the 14-day MA hiked from USD 792,837,293 on March 09 to the present day value by 11.03%. The uptrend in the market trends forces the cryptocurrency into a bullish market.
Advertisement
Analysis of the pricing movements by CoinMarketCap deduces the current price of USD to be $0.316702 on March 23 at 15:54 UTC. The MCAP/USD pair merged at the beginning of 2019; however, eventually, they have been running parallel to each other, with the price of USD dominating the market. The price of USD shared its all-time high and low with the Mcap value on February 24 and February 06, with the values of $0.327648 and $0.242489 respectively, with an average growth of 30.60%. IOTA reached its milestone when the price of USD per coin shot between February 18 and 24, with the values, increase from $0.274221 to $0.322671 with a17.67% increase in 06 days.
Focusing on the price of BTC, the market trend exhibits the bitcoin’s price merging with the MCAP value and the price of USD briefly. The prices opened as high as 0.00010030 at the beginning of January and eventually with the dropping market, reached its lowest on March 07 at 08:34 UTC with the value of 0.00006946. However, the current price of BTC as on March 23 at 15:54 UTC is 0.00007854 which is higher than its all-time low by 13.07%.
Advertisement
The market trend, with the support of the inflating moving averages, exhibits the ascending value of the cryptocurrency, giving the bulls the upper hand. This uptrend turns the market in favor of the buyers as per IOTA predictions. Traders with small term investments must contribute to this market to increase the value of IOTA drastically. That will give an advantage for the investors with long term plans. The outcome would highly profit both of them.


