IOST has been one of the top gainers in the intraday and has strengthened by over 40% so far, followed by Elrond, TRON, and DASH in the top 100 cryptos of the global market. IOST has gained notably after the market crash in the intraday, over the past 24 hours.
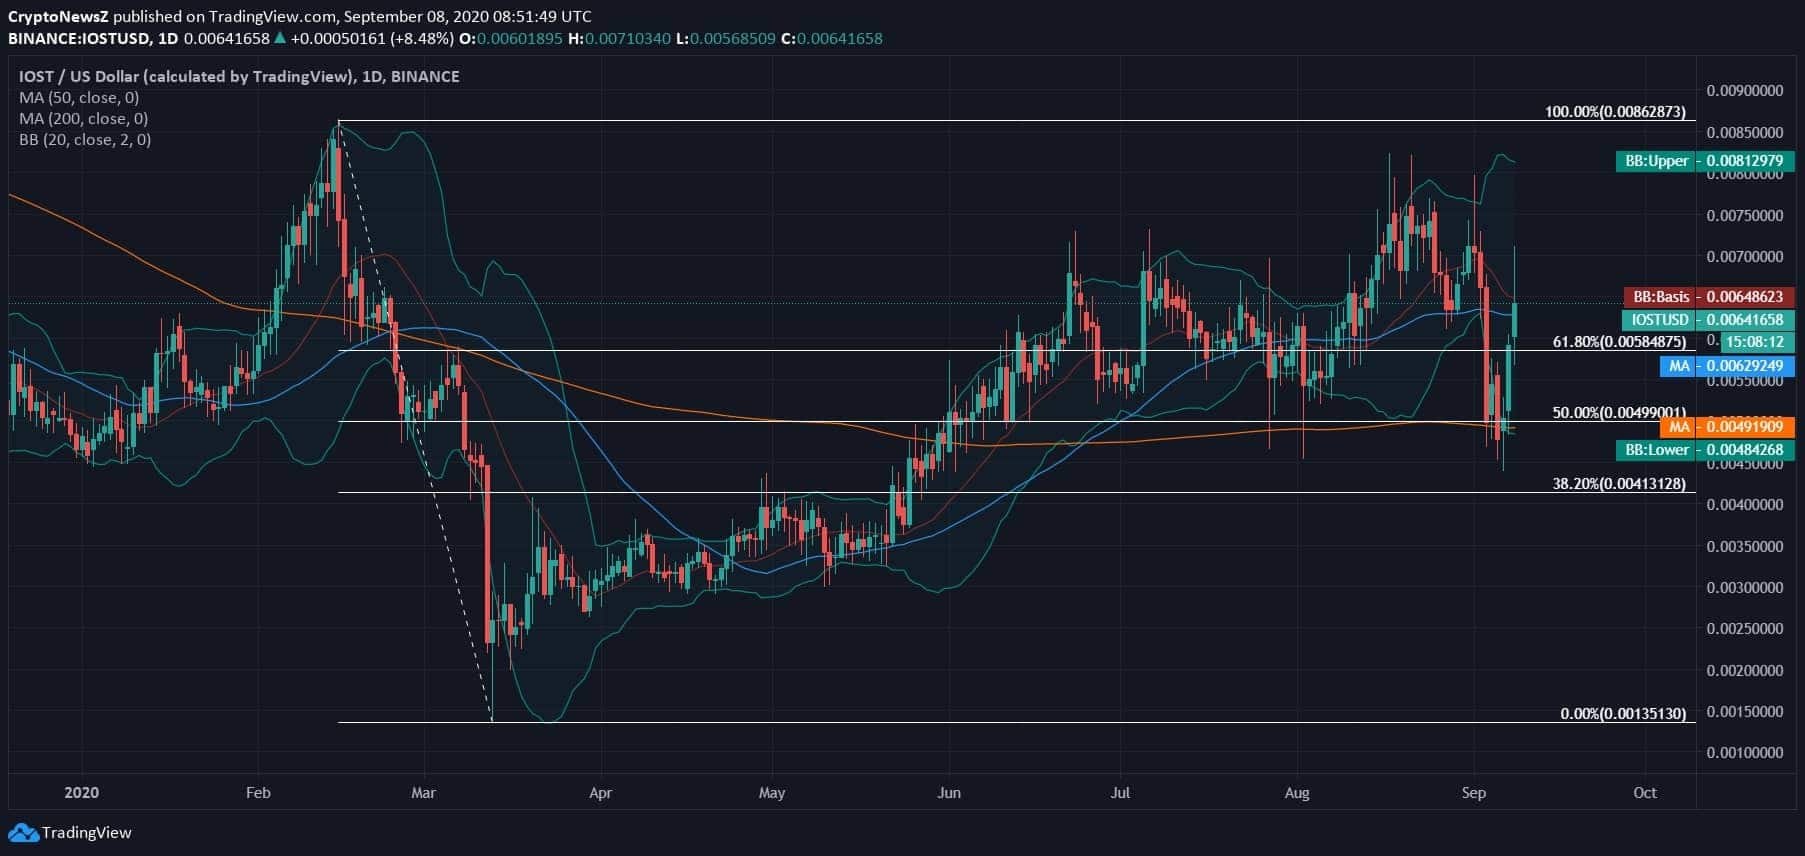
The currency has definitely reversed the loss incurred due to long bearish candle pullback to the current bullish spike and has, therefore, rose above the 61.80% fib retracement level, which otherwise was below the 50.0% fib retracement level.
IOST Price Analysis

Today, IOST was witnessed trading at $0.0064 with a complete gain of steady traction over the last 24 hours. The intraday movement has drawn a positive crossover amidst the negative market sentiments where the major securities are seen accumulating towards the downsides. With a steep candlewick rise, IOST/USD is now trading above 61.80% fib level with an amplified spike above 50.0% fib level.
Advertisement
Moreover, with the recent gush in the momentum of the 100th coin of the global crypto market, IOST is now trading with complete support from MA50 & MA200. The price trend after breaching the lower Bollinger Band is moving away from the sell-off extremities but widens, exhibiting intraday volatility.
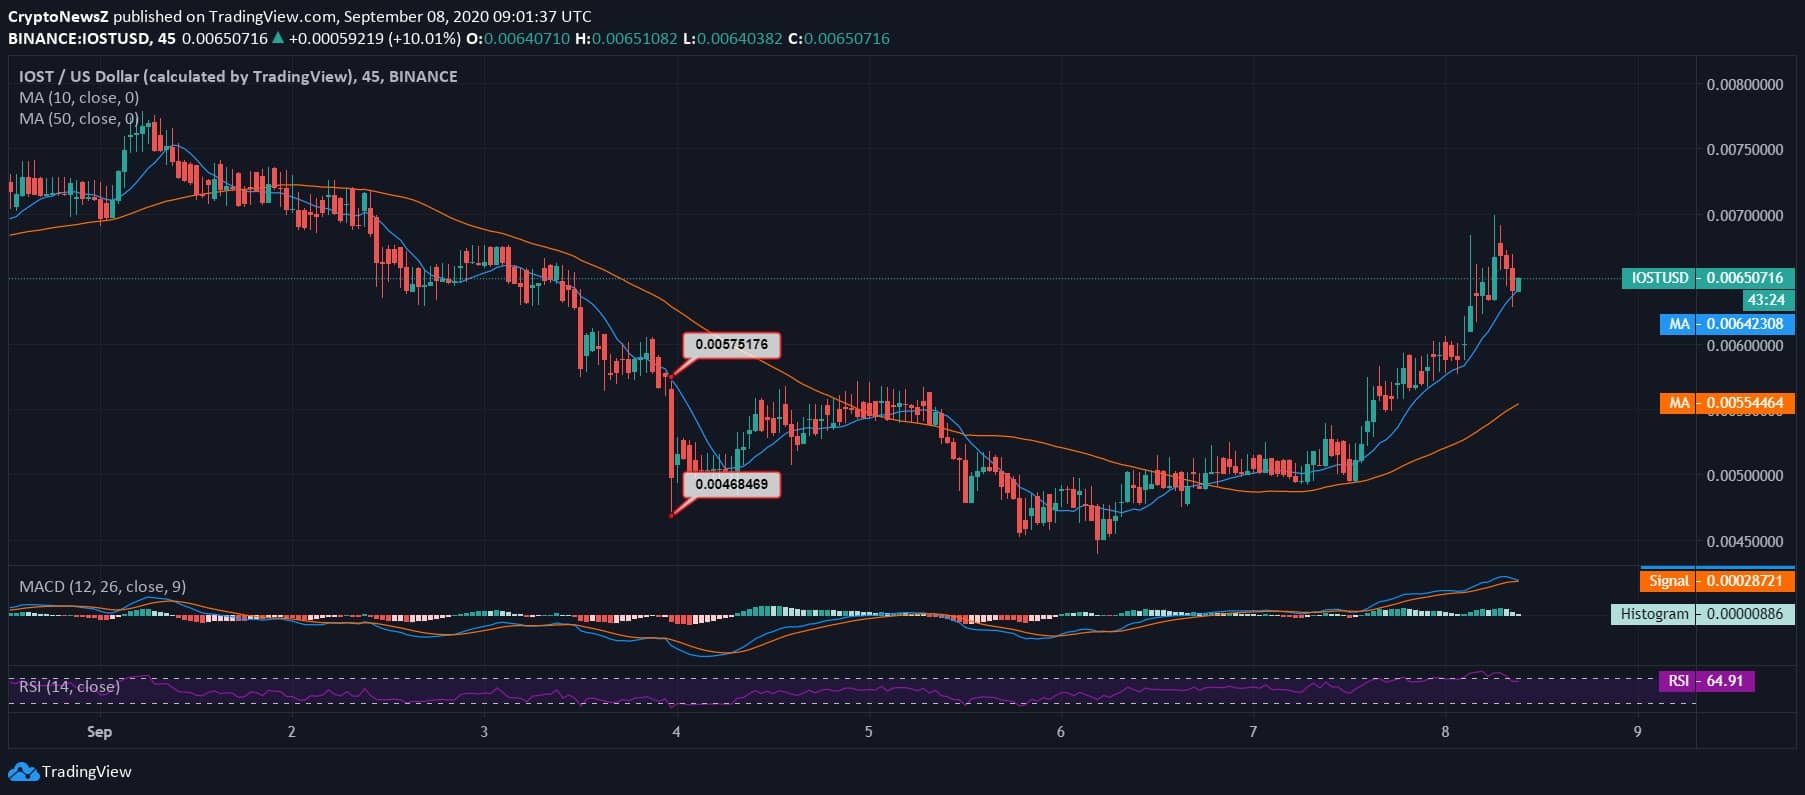
Since the market crashed just at the onset of the ongoing month, the weekly movement over the past eight days has been contradictory as the IOST marks explicit gains in the intraday. It was five days back when the coin lost over 18% with a long bearish candle. However, over the past 24 hours, until the time of writing, IOST price has gained notably over 40% from trading below $0.0050 at $0.0049 to spiking as high as $0.0070. But to know about the upcoming years’ price updates, you must go through our IOST price prediction 2025 for the next 5 years and decide the right time to invest in this coin.
Advertisement
In this regard, the MACD chart shows a bullish crossover on the intraday chart. The RSI is inclined towards the overbought region due to gain in intraday momentum and lies at 64.91.


