Fantom (FTM) has exploded by 63% in just six days, reaching $1.08, a level not seen in recent months. Fueling this rise is a surge in network activity, as daily active addresses hit an 18-month high. According to Santiment data, the Fantom blockchain saw 2,132 unique addresses making transfers on November 24-25, surpassing previous peaks from March and December 2022.
These activity spikes have a familiar ring to them. Historical data shows similar surges during heightened market euphoria, often marking the end of rallies. For instance, in late December 2022, 1,489 active addresses coincided with a price top, as did March 2023’s spike of 2,040 addresses. Both moments led to swift corrections as the FOMO frenzy subsided.
📈 Fantom has been on an impressive tear, pumping +63% in the past 6 days. A familiar surge in daily active addresses has formed on the network, as FOMO appears to be peaking. Historically, these utility spikes from new traders leads to tops. When active addresses fall, a solid… pic.twitter.com/jGrpfZqTt3
— Santiment (@santimentfeed) November 27, 2024
Now, Fantom is approaching a crucial resistance zone that was last tested in April 2022. Analysts caution that a similar outcome could unfold if network activity declines, creating favorable entry points for traders during subsequent dips. With the ongoing rally and market enthusiasm around the FTM cryptocurrency, whether the network’s momentum will sustain or follow its historical precedent of a short-term price correction remains to be seen.
FTM Current Market Overview
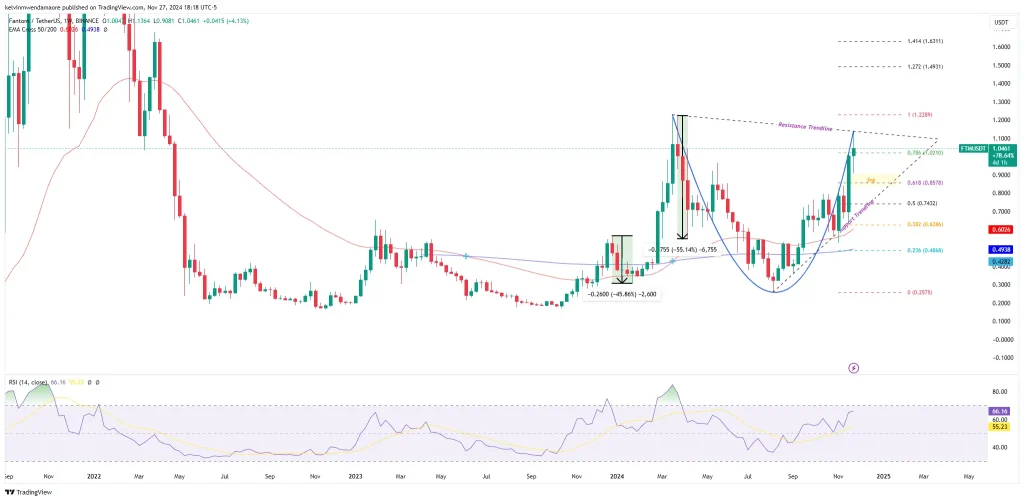
The FTM token now faces a crucial moment as it tests a strong resistance zone near $1.10. The weekly chart highlights a critical confluence of factors shaping this price movement. Notably, the price has completed a classic “cup-shaped” recovery, a bullish technical pattern signaling possible continuation if resistance is broken.
Advertisement
The ascending trendline from earlier 2024 further supports the bullish case, while the 50/200 EMA crossover below the current price at $0.4938 and $0.4282, respectively, suggests a robust medium-term uptrend. However, historical data cautions against overoptimism. As seen earlier this year, corrections have often followed rapid surges.

The Relative Strength Index (RSI) currently hovers at 66, nearing overbought territory, which might hint at slowing momentum. If the RSI crosses the 70 mark, traders could expect profit-taking to kick in, likely triggering a retracement.
A drop below the support trendline or the 0.618 Fibonacci level would signal a short-term reversal, with $0.74 and $0.62 as key downside targets. On the upside, breaking the $1.20 resistance would set the FTM token toward the $1.40-$1.63 range, as indicated by the Fibonacci extensions.
Fantom Price Prediction: FTM to $15
Renowned crypto analyst Captain Faibik has revealed a bold price target for the FTM cryptocurrency, predicting a rise to $15 during the anticipated 2024-2025 bull run. His analysis highlights the token’s recent breakout above a descending trendline, which he identifies as a key signal of a long-term bullish reversal.
This projection represents a 1,685% potential upside from the current price of $1.08. Labeling this moment as the “last buying opportunity” before the rally accelerates, Faibik encourages investors to accumulate the cryptocurrency for the long term while the window remains open.
Advertisement
Also Read: Bitcoin Surges Past $96K; Eyes $100K Breakthrough


