This content has been archived. It may no longer be relevant.
- Ethereum price moves within the range of $167 to $169 since the start of the day today.
- ETH price yet to take a directional stride.
- Investors yet to feel the blow after it breaks out beyond its support at $170 or slides below.
Ethereum has almost remained stable and is having a flat trend as well. Without enough noticeable dips and spikes, ETH maintains the trading range. ETH has also notably accompanied the BTC price dump. This has wiped out the traces of the coin from its moderate market capitalization and 24h volume figures. There is solid selling pressure in the whole crypto space and the coin is no different and has sunk sharply.
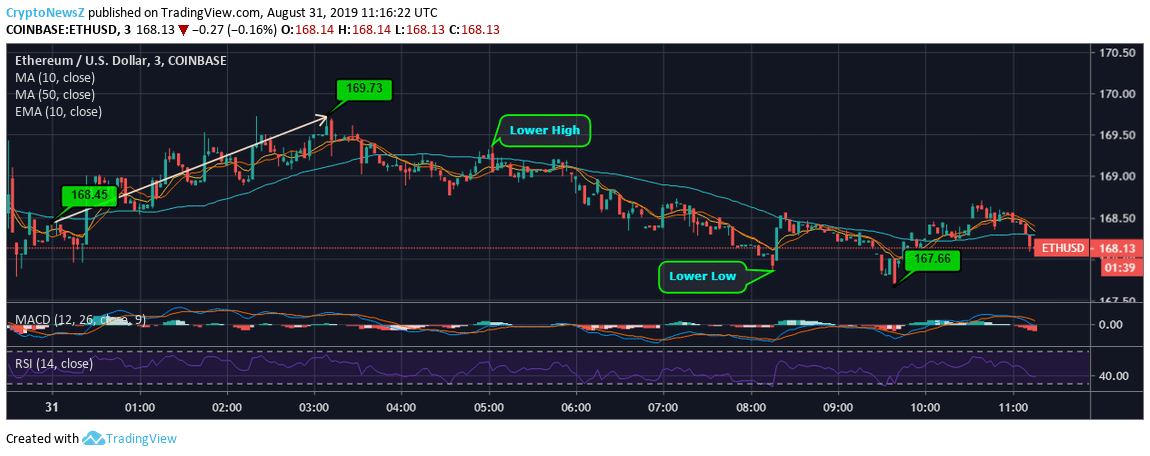
ETH to USD Price Chart by TradingView:
The below Ethereum price chart is a data feed from Coinbase as on 31st August at 11:16 UTC.

Advertisement
Tracing the ETH/USD price movement since the start of the day today i.e. 31st August, we see that the coin has not made any superficial movement to take note of or worry about. Price of ETH was trading around $168.45 at the onset of the day. With a few gradual steps, it rose near to its greatest support area around $170 at $169.73 but could not readily breach the said level. With this the coin manifested a fragile downward stride giving a lower low and lower high with the lowest at $167.66 until the time of penning down. Currently, Ethereum is trading at $168.13 approximately 1.1% away from $170.
Technical Indicators:
Trading with a strong selling pressure, Ethereum has no rooted support from any of the short-term or long-term moving averages.
According to the market expert’s ETH Forecast, once it crosses the $170 price area, the 5-day SMA and EMA will accompany ETH price.
Advertisement
The MACD had a bearish crossover in the positive horizon as the signal line crosses the MACD line with RSI remaining around 40.


