This content has been archived. It may no longer be relevant.
Ethereum is one of the Blue Chips among cryptocurrencies, and currently, it is ranked no. 2 by Market Cap. Ethereum is a decentralized smart contract platform where Ether (ETH) is used as a native token.
Ethereum Price Analysis:
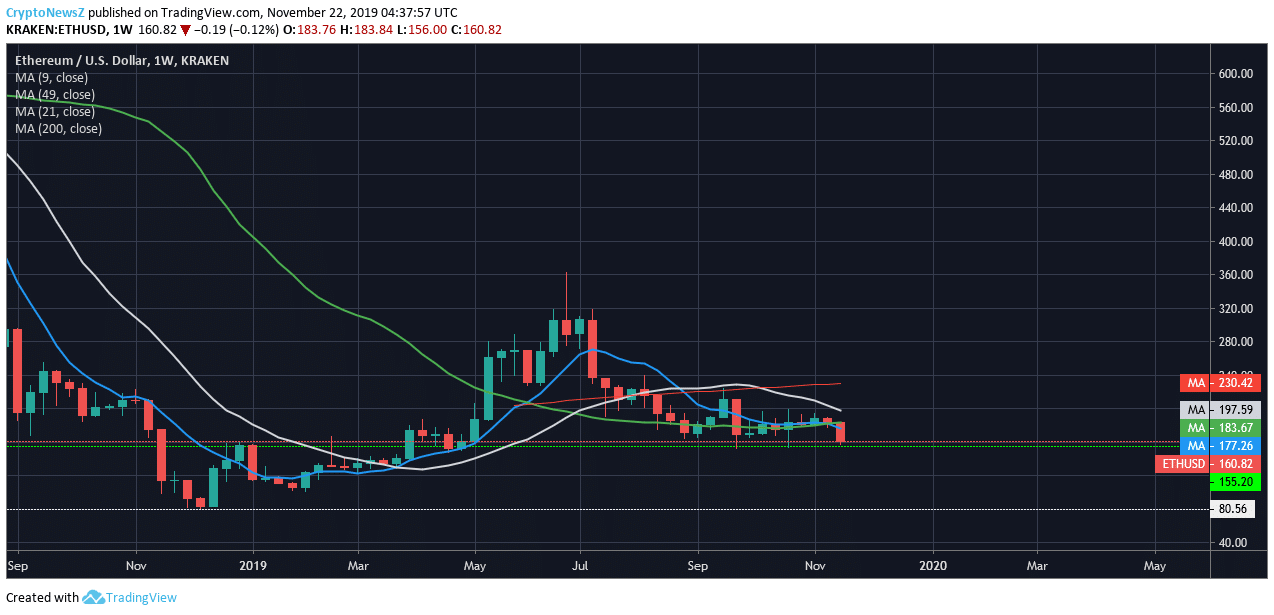
On a 1-week chart, it is clear that the price has been rejected and moving towards key support area around $155, which acted as a support and resistance earlier.
The price of ETH coin was supported by 49 days SMA (Simple Moving Average: solid green line), but it went south as the BTC price broke its support of 61.8% and 78.6% Fib levels. (Green dotted line and white dotted line respectively)
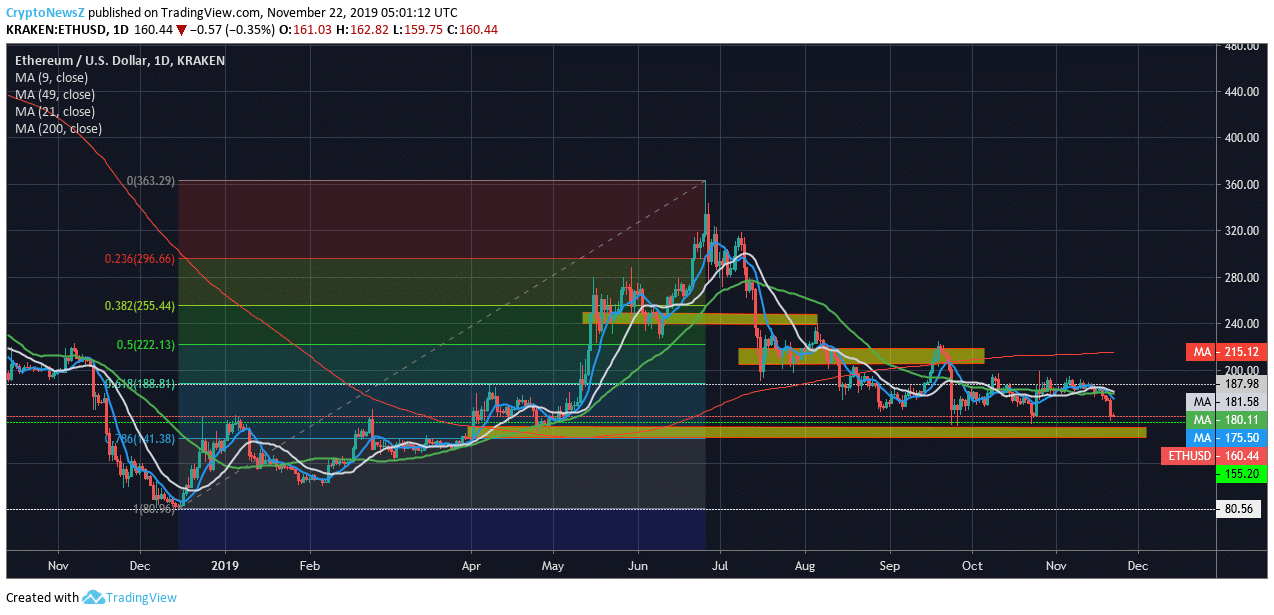
Zooming in at 1 Day Time Frame of ETH/USD, the picture becomes clearer and one can see that Ethereum price was unable to break 61.8% Fib level at $187.98 (marked by white dotted line), which acted as a strong resistance and now heading towards 78.6% Fib level at $141.38 (marked by yellow area at the bottom).
Advertisement
Price is below 9 days SMA (blue solid line), 21 days SMA (white solid line) and 49 days SMA (green solid line) and since price candles have fallen in deep respective to 9 days SMA (Simple Moving Average), ETH price can have a short relief bounce from $150-$155 region to $180-$187 region, before doing a successful S/R flip at 61.8% Fib level at $187.98.
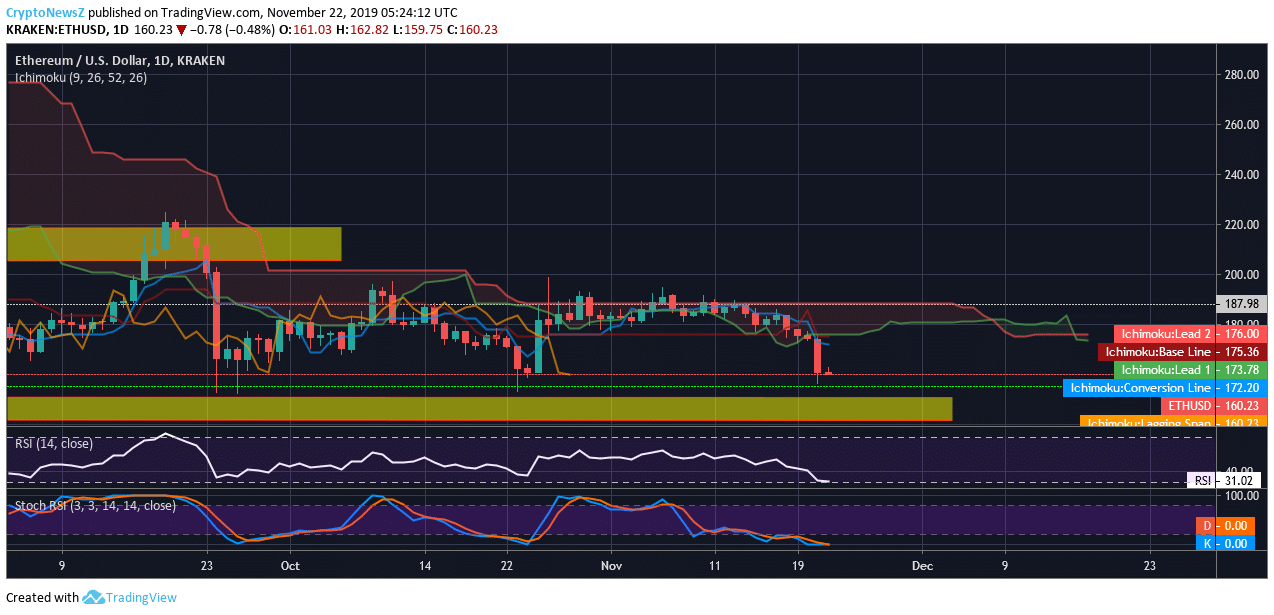
Ichimoku Kinko Hyo too paints a clearer picture as prices are below Kumo, Tenkan Sen (solid blue line), and Kijun Sen (solid red line).
Chikou Sen (solid orange line) is below the prices; all these indicate a bearish scene but an important point to note that the price of Ethereum is approaching weekly key support area, and one can expect a relief bounce from there, i.e., $155.
RSI (Relative Strength Index) and Stoch RSI (Stochastic Relative Strength Index) indicates that the prices have been oversold and ETH prices may see a reversal/bounce soon.
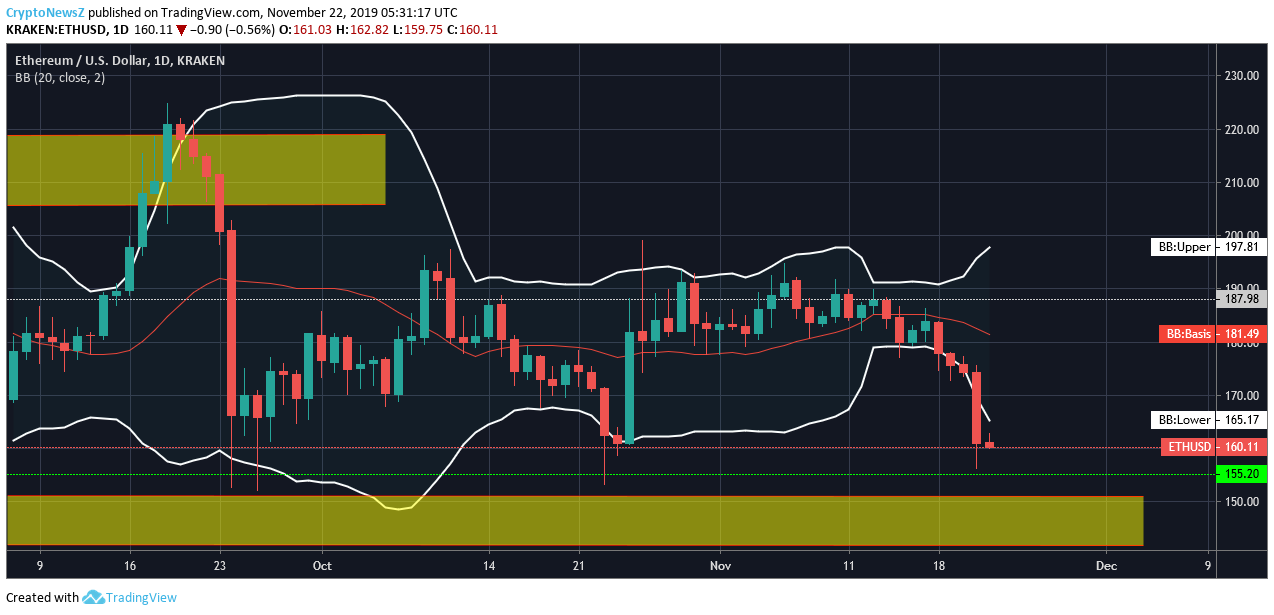
ETH price is currently in lower Bollinger Bands, and thus, it might return to its mean average of $181.49 and has to do an S/R Flip of this mean average line for the upward continuation. Click here to find more details about Ethereum Predictions.
Conclusion: Ethereum is approaching a weekly key support area and can expect a bounce from here as other indicators like RSI (Relative Strength Index), Stoch RSI (Stochastic Relative Strength Index), Bollinger Band all indicating that the currency will see a reversal/bounce soon.
Advertisement
Meanwhile, Bitcoin price is also approaching 61.8% Fib level on a weekly time frame chart, and it may bounce from $7237, which also coincides with 49 days SMA (Simple Moving average: greed solid line).
Until then, expect some more decline in price as both BTC and ETH test its support area of $7237 and $155, respectively.

