This content has been archived. It may no longer be relevant.
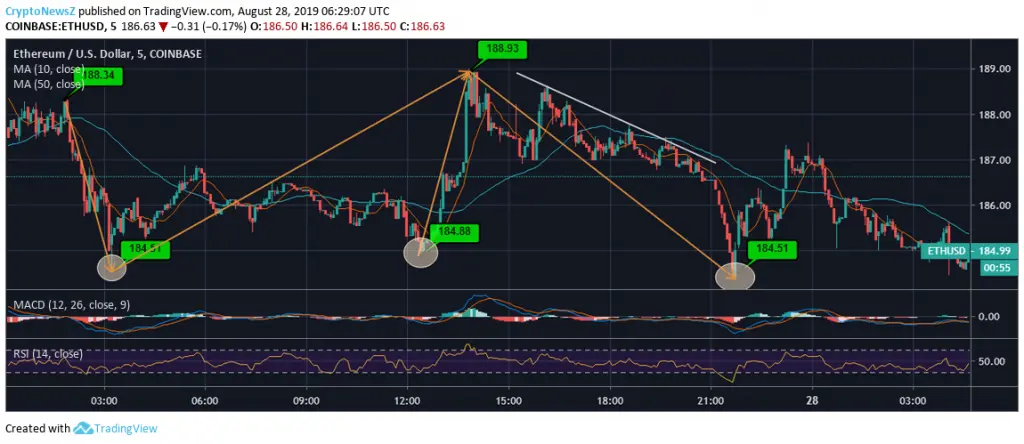
Ethereum price lowly disrespects the support area around $185 and falls to currently trade at $184. Although, ETH price remains close to $185, it has nearly reached a similar bottom thrice with a cent change. This also points to the double top created by ETH at the price level around $188.
Unfortunately, ETH price was unable to hold and has fallen by over 2% in the past 24 hours. At this point $185 is playing a major role in determining whether Ethereum will breakout downwards or upwards.
No short-term moving average seems to consolidate near the current trading price of Ethereum. This midway trading price is facing major support and resistance at $180 and $190 respectively.
ETH to USD Price Chart by TradingView:
Ethereum Price Chart is a data feed taken from Coinbase as on 28th August at 06:29 UTC.

Advertisement
Ethereum price traces around the similar bottom prices every time it dipped in the past 24 hours. $184 price mark remains the most visited with changes in the cent. Even if ETH price tried gaining with every dip, it faced sharp resistance around $188. This has led the coin to dip by over 2% ever time it plunged by having made a pyramidical trading.
Yesterday, the downtrend of ETH was quite visible as it slid in the later hours of the day. This led the diving candle formation at 21:00 UTC all turned red giving a bottom at $184.
This leads to Ethereum facing two bearish days in a row, where it is struggling hard to cross $188 in order to have a bullish crossover by breaching $190. The bearish touch has been really quick which has now left ETH price to take a supporting stride at $180.
As per CryptoNewsZ’s ETH Price Prediction, if Ethereum rightly crosses $190, it will face resistance at $195 having fetched great returns to the investors
Technical Indicators:
The coin continues to trade with a strong selling pressure as it is not rooted by the short-term moving averages as well. The current trading price of ETH is 3.18% and 13.54% less than the short-term moving average i.e. 10-day SMA and the long-term moving average i.e. 50-day SMA.
Advertisement
The MACD of Ethereum has a bearish crossover in the negative dimension below zero with RSI approaching 50 showing no inclinations present.


