This content has been archived. It may no longer be relevant.
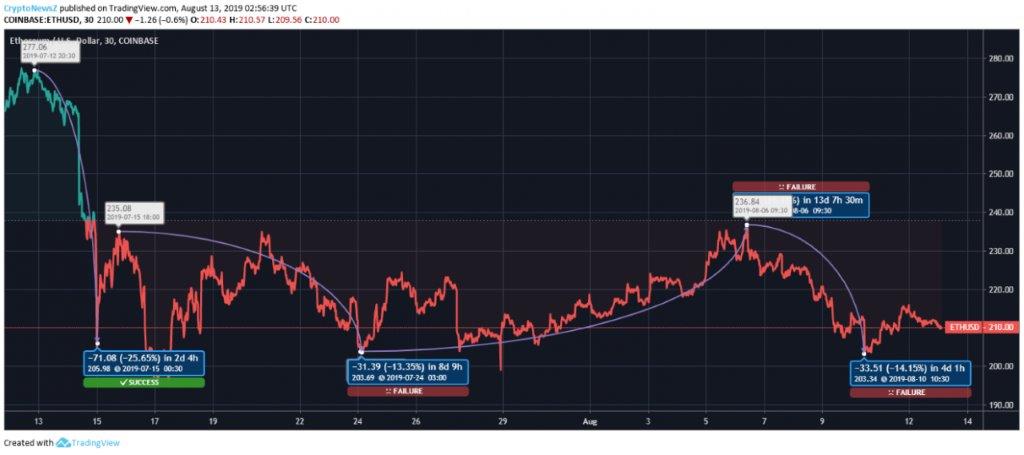
- Ethereum (ETH) falls from 277 USD to 210 USD over the last 30 days.
- It may take more time to bounce back to its previous monthly high.
Ethereum’s last 30 days have been full of struggles and downfalls. The coin has been dragged from 277 USD only to be traded around 210 USD in this same period. We will analyze Ethereum’s price movement over the last 30 days. Let us look at the current details of the coin first.
ETH Current Statistics-
| Ethereum (ETH) | 13th August 02:56 UTC |
| Rank | 2nd |
| ROI (Return on Investment) | 7,320.01% |
| Coin Circulation | 107,297,699 ETH |
| Market Cap | 22,550,430,001 USD |
| Value in USD | 210.00 USD |
| Value in BTC | 0.01844506 BTC |
| 24h Volume | 5,653,308,993 USD |
ETH to USD Comparison-
Advertisement
On 12th July, Ethereum was near 277 USD. Suddenly, it started falling and reached 205 USD by 15th July. This marks the starting of Ethereum’s struggle. After a few hours of strengthening, the coin again went down and this time it touched the lowest point of the month at 203 USD by 24th July. However, the coin could get a push of 16.44% and by 06th August, it was near 236 USD. The latest variation came as a devaluation of the coin by 14.15% and it took the coin to 203 USD. The current value of Ethereum against USD hovers around 210 USD.
ETH Price Prediction-
Advertisement
Ethereum is the second-largest coin of the market so it has strong fundamentals to back its growth story. as Ethereum Prediction evaluated by expert, the coin is likely to touch 410 USD by the end of this year. But there is no sign of exponential growth in the near future. These are the resistance points and support levels of the coin.
| Ethereum (ETH) | |
| 1st Resistance | 214.6366667 USD |
| 2nd Resistance | 217.9833333 USD |
| 3rd Resistance | 219.8266667 USD |
| 1st Support Level | 209.4466667 USD |
| 2nd Support Level | 207.6033333 USD |
| 3rd Support Level | 204.2566667 USD |


