Ethereum’s gas fee turning the lowest on June 06 has created a huge rallying environment for ETH. Norton, the world-leaning anti-virus software, has been making rounds at countering crypto mining issues. Norton announced plans to launch Ethereum mining software.
The idea behind this announcement is to create a safer means for trying crypto mining. The only show stealer would be the release of Ethereum 2.0, where ETH will be moving towards a proof of stake for lower energy consumption and higher scalability.
ETH Technical Analysis
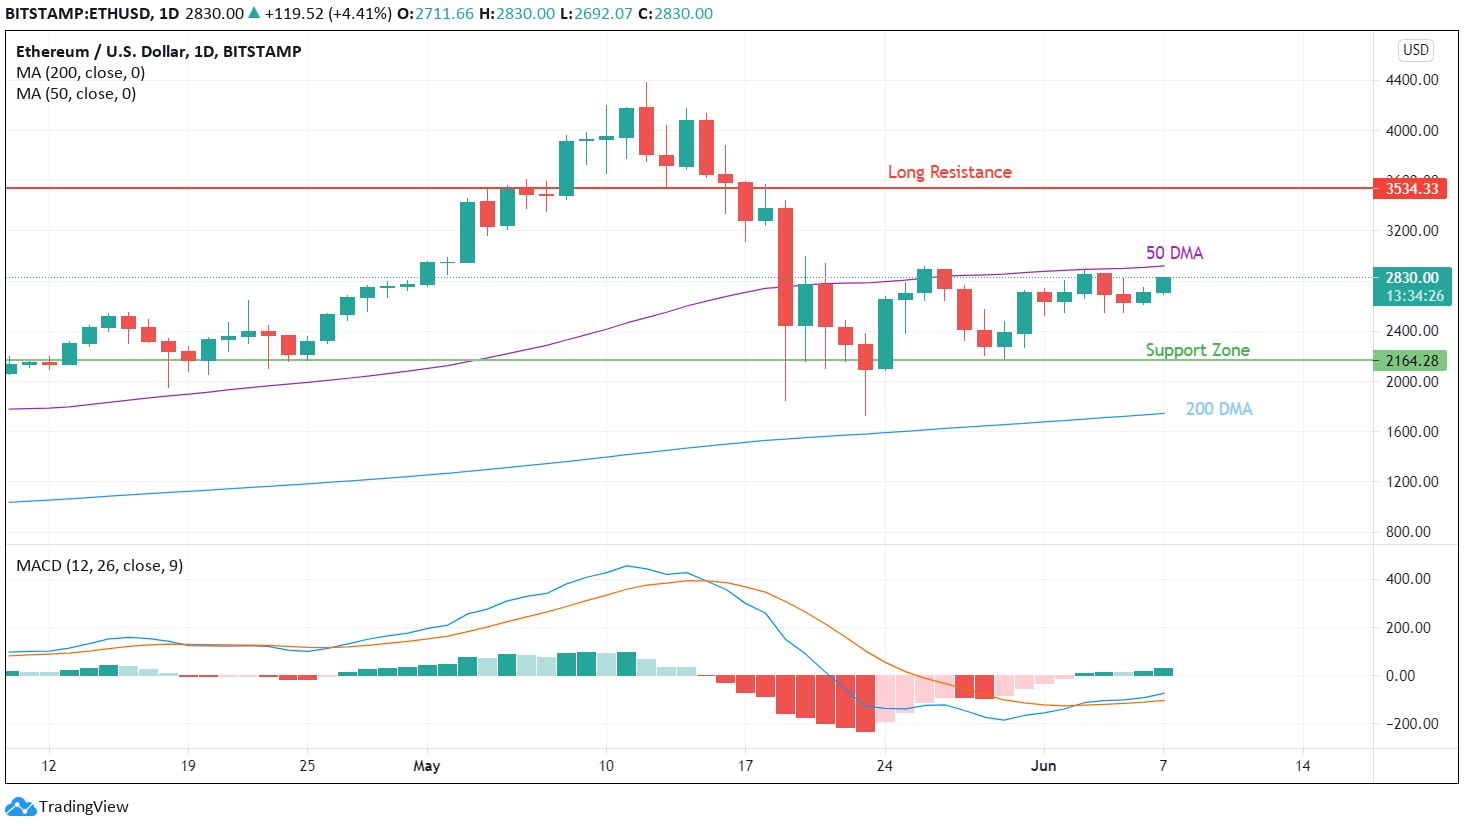
Normal charts show a strong up move with a marubozu type green candle. We can also identify a consolidation zone heading upwards with downward consolidation at $2627.
ETH has presented a consistent volume and price trend without a hint of volatility. Currently trading between the two major moving averages of 50 DMA and 200 DMA, we find the 50 DMA to act as the immediate resistance towards any up move while 200 DMA is working as strong support to counter any sell-off on this crypto counter.
Heiken Ashi charts show preparation for an uptrend as Ethereum is posing with a green candle on daily charts. This time, if the momentum sustains for a handful of days, the ETH price can easily surpass the $2900 resistance to take the long term resistance placed at $3525. A good breakout with considerable volume can push ETH up by more than 60% in a matter of days. Otherwise, we will be witnessing a profit booking and reverting back to the $2500 levels.
Advertisement
MACD is indicating a strong sign of continual up move after the golden cross over made a few days ago. Ethereum can attempt to retest the near term resistance of $2900. Making immediate purchases for the long term at these levels can be risky. Investors are suggested to take advantage of moving averages and wait for ETH to cross the $2900 or the resistance level of the 50 day moving average.
Ethereum on daily charts seems to have struck in a dead zone. The consolidation in the immediate trading range of $2500 to $2900 seems to compress the price momentum in tight zones. The breakdown in prices witnessed on May 28 was quickly turned around by the strong support placed at the $2200 range.
For now, the price of Ethereum will remain in this consolidation range until there is a broader momentum of the crypto market. Being the second largest cryptocurrency by value, there is a huge potential in ETH waiting to be realized.
MACD on one hour charts indicates a positive move backed by the divergence from an intersection, which would have indicated a bearish trend. Currently combining the MACD, dropping volumes, and positive candles on hourly charts direct towards some comeback.
Heiken Ashi charts combined with RSI can provide a clear indication of the likely short term outcome. The histogram on RSI is headed towards overbought zones indicating strong buying in the short term. The Heiken Ashi charts show a big breakout. If followed by another positive candle, it has the potential to break out from the consolidation zones.
Advertisement
However, lower volumes combined with overbought zones in RSI indicate a complicated scenario of a false breakout. Only two of the counters are proceeding with a potential for a strong up move, while another indicator shows lower trading volumes. If such a scenario continues by the time the prices reach the upper threshold for consolidation zones, we can likely witness a pull back or retracement to a maximum of $2500 levels. Based on our Ethereum price prediction, investors can take a calculative risk at this point for a positive breakout and hefty profits.


