Despite maintaining a dominant stance in a smart contract and supporting the decentralized application, Ethereum has gained several competitors eyeing for better market position. The latest market value of $154 billion remains a mountain to be breached by low-value projects.
Crypto projects are facing drastic challenges after the LUNA and FTX fiasco. Hence, trust in a stabilized cryptocurrency such as ETH has just strengthened. Ethereum is just 110% short of becoming the market leader above Bitcoin at its current value. With the previous uptrend heights reached by ETH, a positive breakout for the token surpassing others should not come as a surprise.
Ethereum Price Analysis
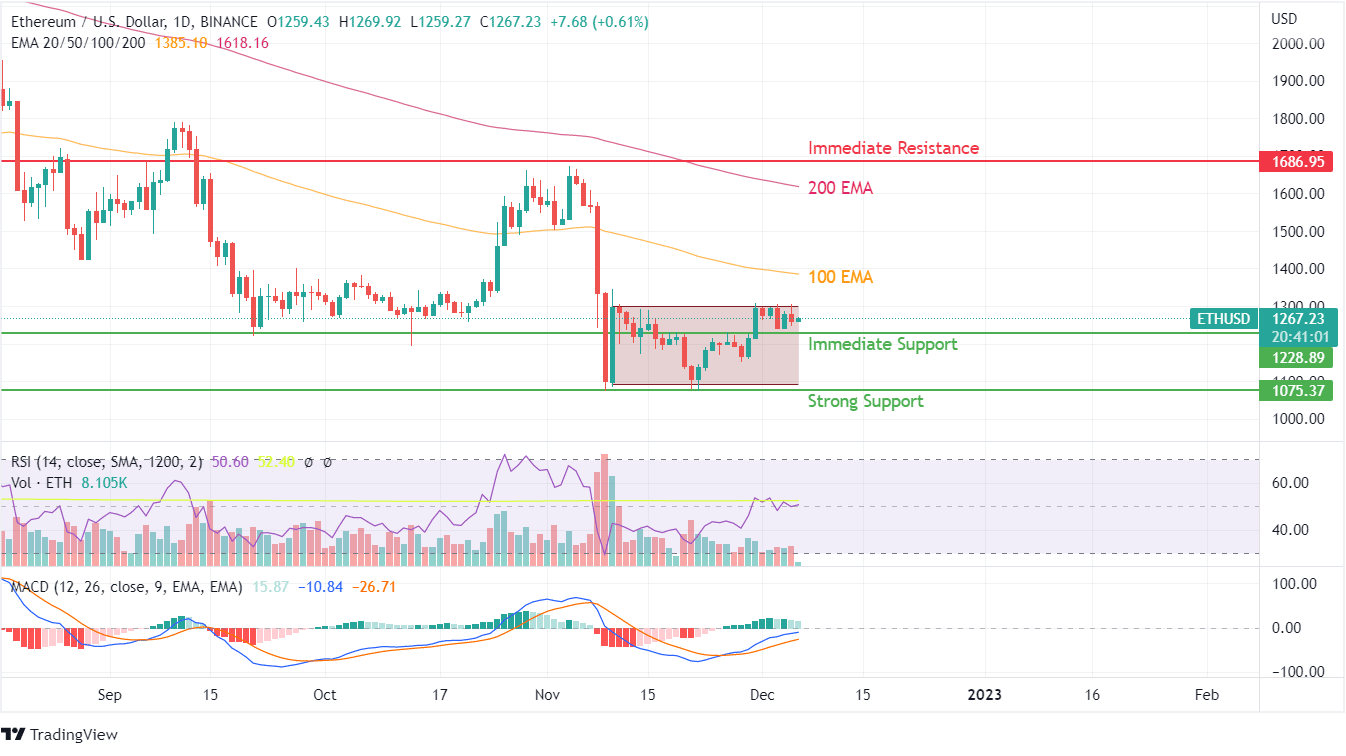
ETH has found support at $1075 as selling activity suddenly halted at this level. The price momentum, however, has remained under a short consolidation with the upper band of $1270 and a lower band of $1075. The resistance of moving averages has become a tougher challenge for buyers.
Advertisement
Ethereum has maintained a close resemblance to Bitcoin’s price action and maintains a similar price action. However, the recent decline in selling activities as prices hit the lower band of their previous support level of $1100 saw positive buying action from enthusiasts. Especially for BTC and ETH, buying on dips has become one of the most effective strategies for making profits.
Holding for Ethereum saw a decline during the initial phase of its transition to proof of stake, and currently, the token is witnessing a buying spree. From the technical indicator RSI, the stature of positive sentiment can be confirmed, reaching 50 from 35 within two weeks. The minor breakout pattern has also controlled the selling sentiment and showcases an uptrending probability as ETH nears its moving averages.
100 EMA curve for ETH trades at $1400 while the 200 EMA curve moves at $1600. From a price action perspective, $1685 would be the toughest resistance level on the short-term uptrend. MACD, during this positive movement, has jumped close to the positive side with declining momentum. Buyers should technically wait for a breakout pattern at 100 EMA to make a quick profit or stay invested to booking some profit at the 100 EMA curve.
Ethereum is moving in a downside movement since hitting its peak of $2000 in August 2022. The resistance weighs heavier with each swing resulting in the creation of a new support level, which is quite often short-lived. Current support of $1075 can create a downward spiral for ETH. Since the latest value of ETH trades 18% above the support level. Hence, based on our Ethereum price predictions, the probability of a continued uptrend remains higher.
Advertisement
Technical indicators seem to be refraining from delivering any positive outlook, even in the longer-duration charts. Being the third consecutive positive weekly candle, ETH will have a tougher resistance at the $1335 level. Hence a lack of buying sprees can be noticed here.


