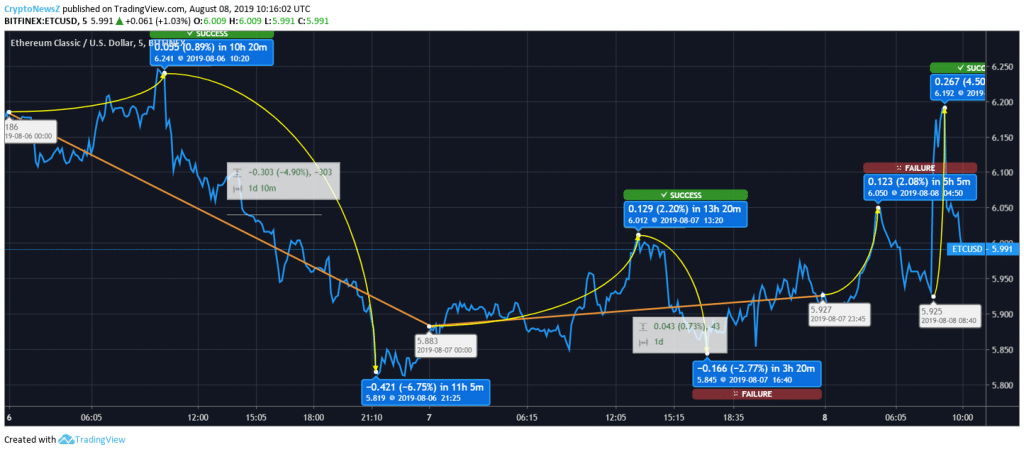
Ethereum Classic chart is reflecting a heavy recovery in the coin. The currency opened at $6.18. The escalation was of 0.89% as the coin went up to $6.241. Later, the coin slipped from $6.241 to $5.819 by 6.75%. The intraday loss was of 4.90%. Yesterday, the coin jumped from $5.838 to $6.012 by 2.20% during the first few hours. The currency slipped from $6.012 and took it to $5.845. The regression was of 2.77%. The coin closed at $5.9 by 0.73%. Today, the coin again opened with an escalation of 2.08%. The counters switched from $5.927 to $6.050. There is another progression marked in the coin. The escalation was from $5.925 to $6.192 by 4.50%.
ETC/USD Price Chart:
Advertisement
The chart is taken from TradingView on 08th August 2019 at 10:16:02 UTC. However, you should know more about ETC price prediction and the chart patterns before you choose to do anything.

Current Statistics of ETC:
| Particulars | Ethereum Classic (ETC) |
| ETC Price | 6.03 USD |
| ROI | 701.78% |
| Rank | 20 |
| Market Cap | 678,906,590 USD |
| Circulating Supply | 112,547,711 ETC |
| 24-Hour Volume | 545,229,880 USD |
Ethereum Classic Price Prediction and Conclusion:
Advertisement
Ethereum Classic has started the recovery. According to the stats, The coin would be seen touching new highs in some time. The traders interested in the coin can go for a short-term investment to ensure profit. The long term is not as promising as the short term. Hence, we aren’t recommending the same.


