Ethereum Classic blockchain is an exact copy of the more popular Ethereum blockchain, emphasizing smart contracts and providing supporting platforms for decentralized applications. ETC price action has mostly remained trapped in a narrow zone with high volatility since several Proof-of-Work-based blockchains provide high mining rewards. As a voluntary organization, ETC has no plans to turn into a for-profit blockchain, yet it has an army of developers working to enable further scaling on this blockchain. Unlike its counterpart ETH, ETC ranks quite low at the 19th position with a market capitalization of $5 billion.
The recent traction on ETH has also been helping ETC grow, as it began a tremendous uptrend in just two months. Currently reeling under profit booking, ETC is trading above its immediate moving averages.
Advertisement
The price action is immensely stronger as current consolidation is taking place above its key moving averages. With the fifth consecutive positive day, ETC has finally taken support from the lower band of its active previous consolidation zone. Read our ETC price prediction to know if this uptrend will continue or not.
Ethereum Classic, for the first time, has surpassed ETH in terms of momentarily gains. With repeated breakout from 200 EMA, the resistance has shifted to a higher value of $50. So far, August has been a positive month with price action, but the profit booking on August 19 made a major dent in the buying sentiment of ETC. This price movement indicated a significant RSI drop, which was a major movement in a negative direction.
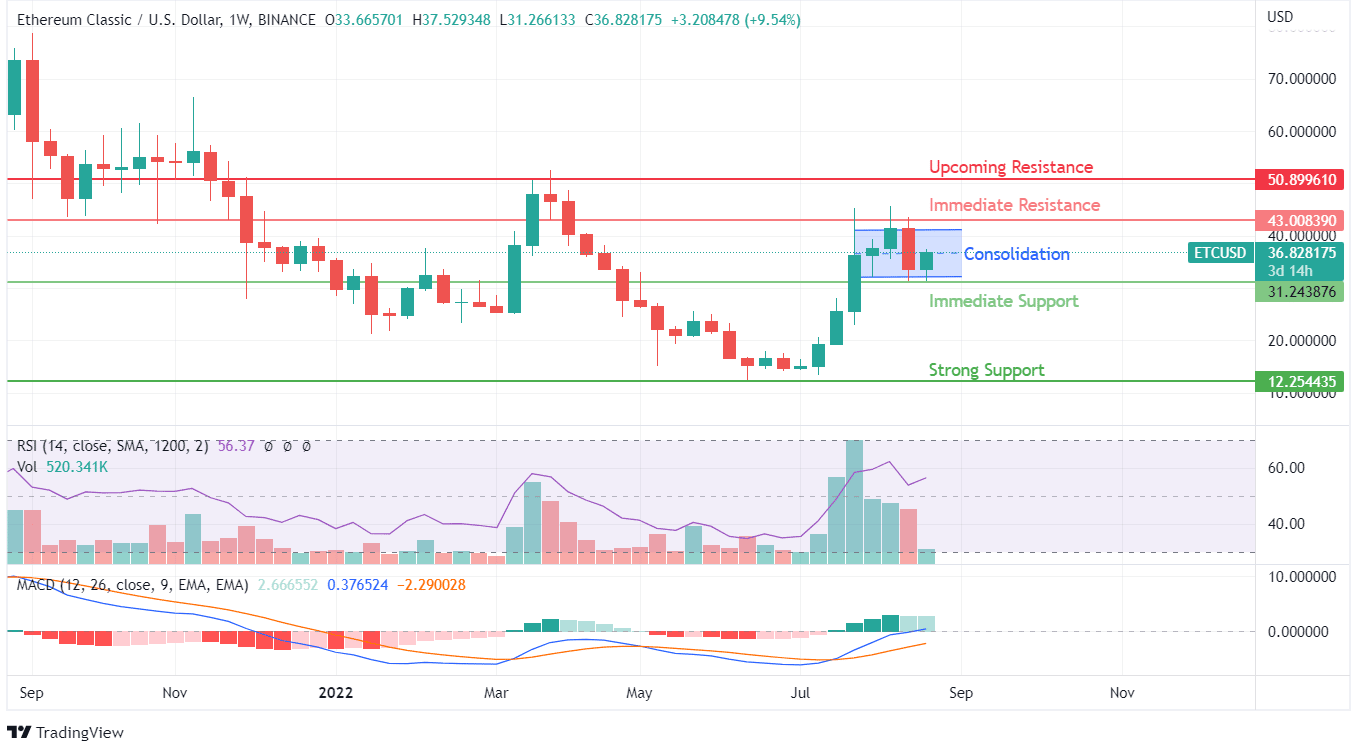
MACD on daily charts is finally headed towards a bullish crossover. Combining the outlook from MACD with RSI shows much higher uptrend potential for ETC. It has gained significant value in the last six days and remains short of the peak value of August 19, 2022. $43 would be the first resistance ETC needs to breach to maintain its uptrend outlook.
Advertisement
On weekly charts, the ETC price action shows the presence of a bearish engulfing weekly candle, but the consolidation zone of daily price action is defended even on this chart. RSI on weekly charts is just as strong as seen on the daily charts, while MACD showcases the little potential to make a bearish crossover. The upcoming resistances would be $43 and $50, while support can be expected from $31 in case of unexpected profit booking.


