This content has been archived. It may no longer be relevant.
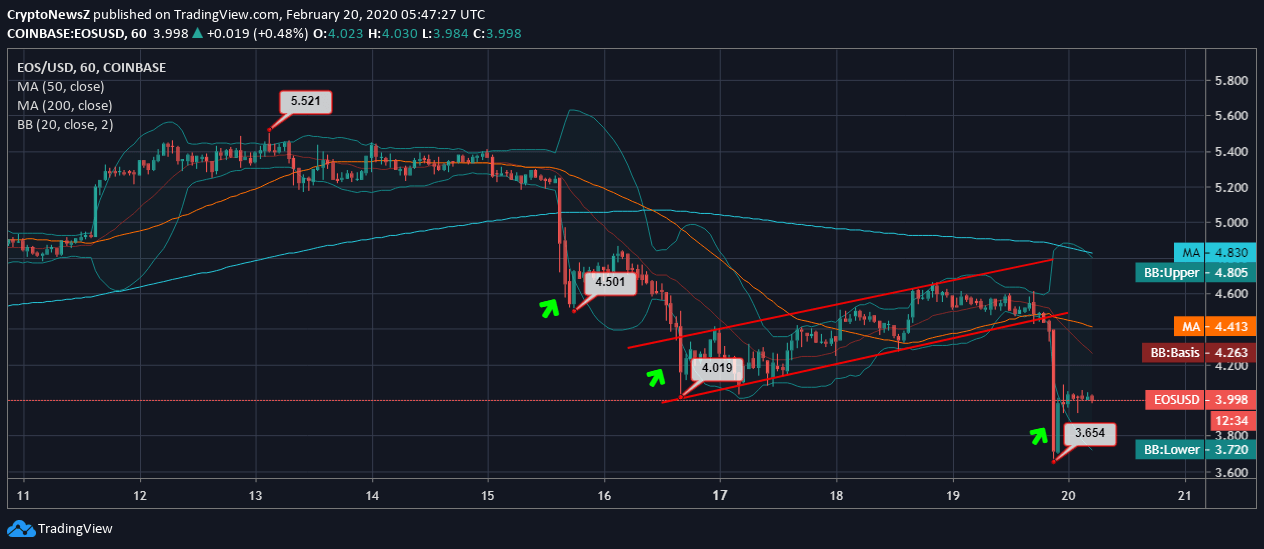
- EOS, at the time of writing this analysis, was trading around $4.0, after recording a steep fall at $3.66
- Over the past 24 hours, EOS/USD took a sharp dip from the trading price of $4.4 to $3.6, marking a regression of over 18%
- We project about a bearish divergence due to “death crossover” as the 200-day MA crosses above 50-day MA on an hourly chart
- Also, we foresee volatility in the upcoming days as per the 20-day Bollinger Bands laid
- The price trend of EOS against USD has experienced several downside breakouts hitting the lower Bollinger Band
Bitcoin price slides below $10,000 again after a day of a bullish crossover, hypothetically influencing the major altcoins, as the market turns red. EOS price faces a sudden pullback where the coin lost over 18% in less than 24 hours.
EOS Price Prediction

Analyzing the hourly movement of EOS/USD on Coinbase, we see that the coin has faced a massive correction over the past 10 days, from trading at $5.52 to bottoming out at $3.65, marking a regression of over 33%. Over the past three days, the EOS coin price trend exhibits a rising wedge after falling from $4.5 due to a lack of steady support. This is rightly strengthening the long position holders yet appears bearish as it hits through the lower 20-day Bollinger Band.
Advertisement
Alongside, the 200-day MA crosses above the 50-day MA, exhibiting a bearish divergence and hints towards the upcoming volatility as the 20-day Bollinger Bands widen.
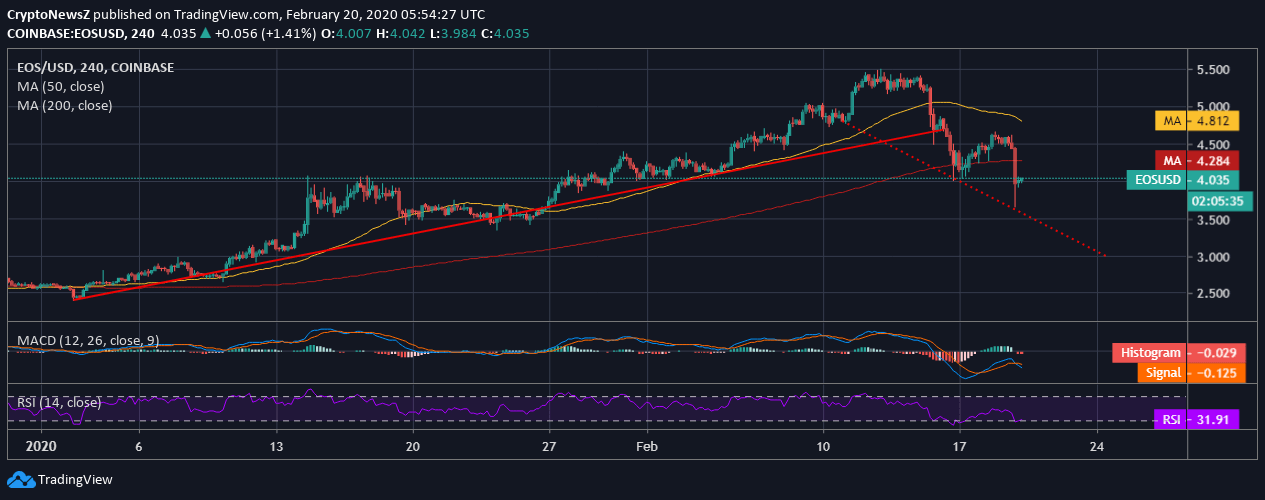
Moreover, if we take a glance at EOS/USD 4-hourly chart on Coinbase, we see the rising trend that was anticipated to form since the start of the year has been interrupted by the accumulating price fall in the past ten days.
This steep fall has also turned the technical indicators to turn bearish as the MACD of EOS holds a bearish divergence after the signal line crossed above the MACD line.
Advertisement
Similarly, the RSI of the coin is at 31.91 and holds a selling pressure nullifying the long position held.


