This content has been archived. It may no longer be relevant.
- EOS trades with a downswing at $2.7, just when the king of cryptocurrencies trade around $7,600
- EOS has been on a downswing after having recorded the height at $8.9 in the month of June, as per the data feed from Coinbase
- Important to note that the EOS price has been below $4 since the last week of September and has made no attempts to even trade beyond $3.7
EOS records a plunge of 10% from $3.10 to dropping at $2.77 in the past 24 hours. The whole crypto market had crashed in less than just 24 hours, yesterday, when all the major coins ripped of the gains rapidly. BTC price trades below $8,000 after almost 4 weeks of persistent trading, ETH price slides below $170, $165, and currently trades near to its major support level at $161, XRP records the drop at $0.24 while Litecoin stays put at $50.
EOS Price Analysis

Analyzing the 6-month trading duration of EOS/USD on Coinbase, we see that the coin was trading at the height of $8.96 when the resonance in the market called in. And since then the price is on a continual downswing hitting major supports at $8, $7.5, $6.5 and gradually even below.
Advertisement
Important to note that EOS has been trading below $5 since the 2nd week of July and has been slipping densely. This long-term trading duration only withholds a fall throughout, in the said duration.

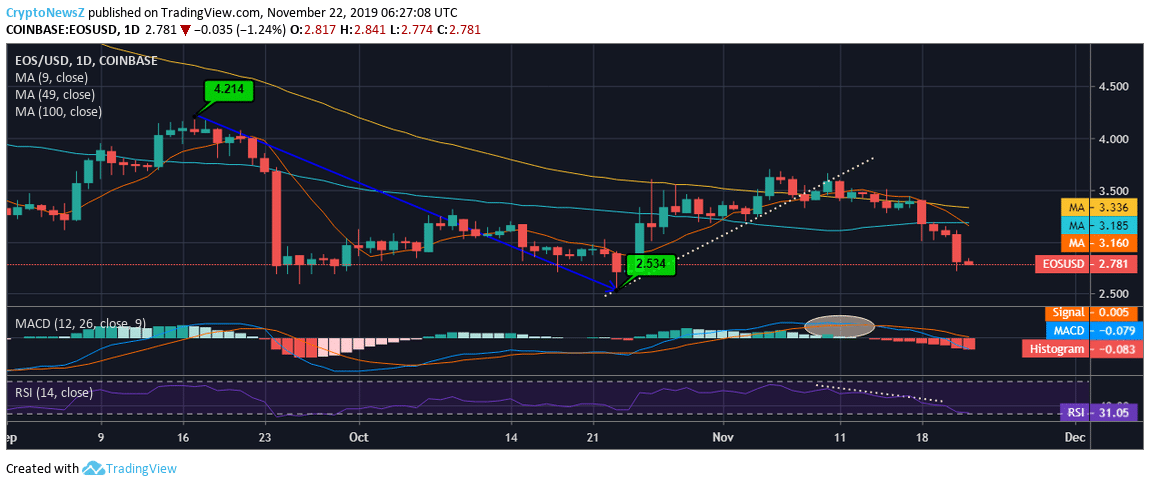
However, we confirm the same downfall with the above 90-day trading duration chart, wherein we see that the coin has been consolidating within the price range of $4.214–$2.534. Currently, EOS trades quite near to the lowest in the said time frame, i.e., at $2.781 and indicates a fall even further. There is a solid bearish outlook as the immediate red candle formation, and no support from the moving averages confirms the further decline.
Technical Indicators
Neither the short-term nor the long-term moving averages are providing grounded support to the current trading price range. The 9-day, 49-day, and 100-day MA lie at $3.160, $3.185, and $3.336, notably above the current trading price.
The MACD of EOS is running with a bearish crossover as the MACD line appears to be sliding below zero.
Advertisement
While the RSI stands at 31.05, it also exhibits a falling trend, being inclined towards the oversold region.


