The EOS price is currently falling on the intraday chart. The indications for improvement in price in today’s chart are thin. Although the market is moving up and Bitcoin has also opened with a bullish trend, EOS stands unaffected by any of it.
However, EOS will soon recover and climb up on the chart. The current fall in price is temporary and has no legs. The traders sweating because of the present scenario in EOS will be soon seen grinning as the price is expected to hike.
Let’s have a look at the year to date price chart of EOS.
EOS/USD YTD Chart:
Advertisement
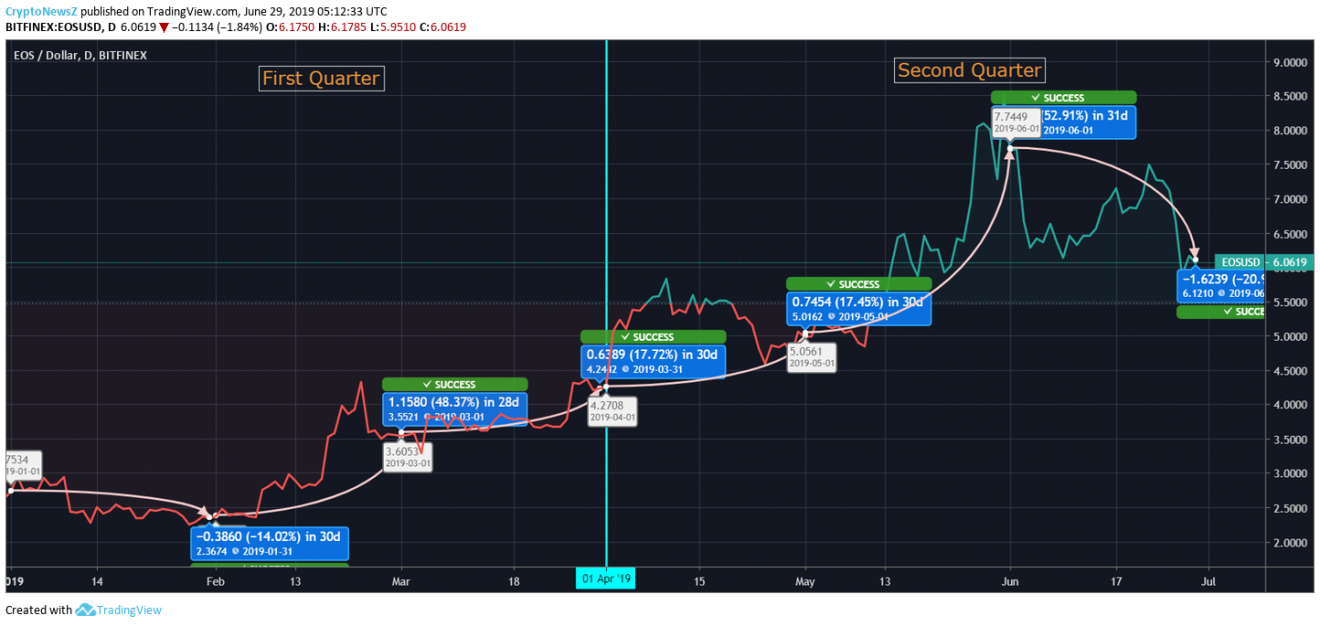
The chart is taken from Trading View on 29th June 2019, at 05:12:33 UTC.

The first quarter of EOS was moderately profitable. In January, the coin opened at $2.7 and closed at $2.3. The regression marked was of 14.02%. From February, the momentum started improving in EOS. February booked 48.37% improvement in price; the counters changed from $2.3 to $3.5. March was less impressive if compared with February but still marked positive numbers by 17.72%.
The second quarter was wildly active and booked some great numbers. In April, the improvement in the chart was of 17.45% as price shifted from $4.2 to $5. May was the most active month among all. The progression locked was about 52.91% as price hiked from $5 to $7.7. However, in June the coin is back to $6.1.
| Particulars | EOS |
| Price (USD) | 6.11 USD |
| 24hr Volume | 3,490,084,432 USD |
| Market Capitalization | 5,631,497,364 USD |
| Rank | 6 |
| Return on Investment (ROI) | 492.82% |
| Circulating Supply | 921,091,357 EOS |
EOS Price Prediction and Conclusion:
EOS has almost tripled the price from the beginning of the year till now. The momentum of the price is undoubtedly great, and hence, the future is likely to be good.
Advertisement
The long term and short term investment in EOS are quite promising. The coming years in EOS are anticipated to lay good results. We are assuming that by the end of 2019, EOS will be seen dealing around $10.


