The name Elrond mustn’t necessarily ring a bell, but it’s among one of the leading Dapps supporting blockchain platforms. The fact that it tends to bring together two of the most astonishing components of the modern age, blockchain and the internet, together provides a better insight about the scalability and growth prospects of the Elrond blockchain network.
Moreover, it is gaining more and more news traction and popularity for becoming the first carbon zero blockchain network in the entire EU. Elrond is not an old cryptocurrency network, and it was released on the main net only in July 2020 itself. It has been trading on platforms like Binance US since September 2020. Elrond can possibly fuel the entire internet economy without including too many stakeholders. It uses Adaptive State Sharing and Secure Proof Of Stake protocols to create a truly decentralized blockchain network.
On technical terminologies, it is quite sound and shows signs of immense bullish sentiment that seems hard to put down. After its recent breakout, candle patterns and trading in the green over the last couple of days have created a huge positive sentiment for Elrond in every investor’s mind.
Elrond Price Analysis
Advertisement
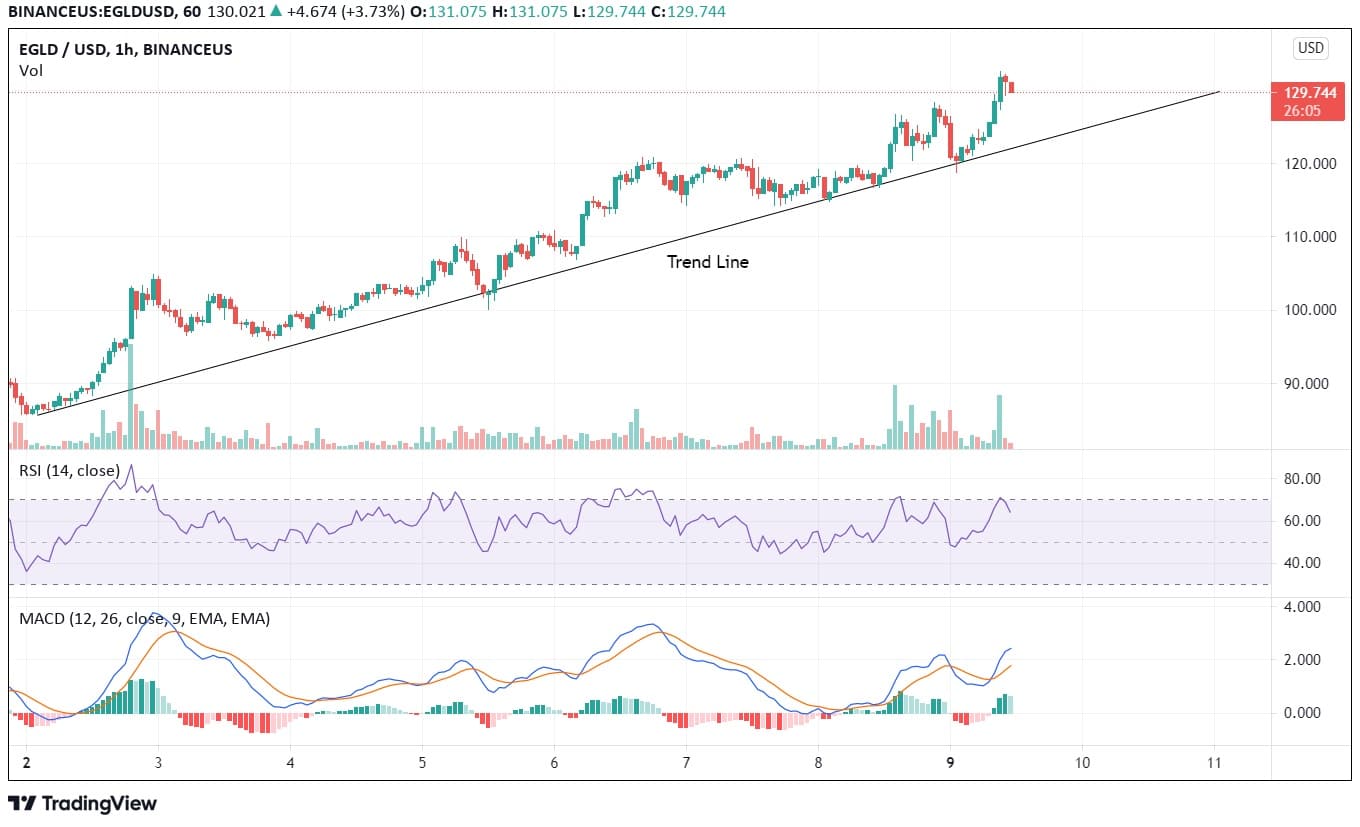
Elrond hit its all-time high of $243 on April 11, 2021, in a matter of fewer than eight months, from its launched trading value of $9 on September 24, 2020. The rally of 2600% is just mind-boggling. But as Elrond climbed to new highs, it fell to $53 on July 22, 2021. The sudden volatility distracted investors from Elrond, but after taking support from its range of $58 to $66 twice, Elrond is on a one-sided momentum towards $130, which is over 160% of gains in just 20 days.
The swift price action and buying push have enabled EGLD to break its resistance zone in just one attempt, which speaks volumes about this cryptocurrency network’s further possible price action. August 08, 2021, the breakout has been instrumental in adding buying pressure instead of succumbing to the selling pressure generally witnessed close to resistance levels.

Based on our Elrond price prediction, we expect EGLD to consolidate or even retest the lower band of its resistance level before it moves closer to $150 and then towards $200. Another positive aspect of EGLD is it taking support from the 200-Day moving average line, which is another indicator that has added buying support.
Advertisement
The price action shows a rise in volumes on hourly charts in the last two trading days with almost a 10x jump in total volume. Such a rise in interest has allowed EGLD to trade higher and outperform the leading cryptocurrencies. RSI on hourly charts is trading close to overbought zones with the sudden drawdown of close to 50 levels, while MACD is extremely bullish and shows a potential to reach $150 in a matter of days. This breakout, after hours of consolidation, has given immense strength to the entire price action.


