After opening the gates for South Africa, many of the people in the region are topping up with the data and ETN airtime. Well, this seems to be a good start for the Electroneum in that region.
Thousands of people in South Africa 🇿🇦 are topping up their airtime and data with ETN. 🙌📱
Get started today by claiming your free sim from The Unlimited. > https://t.co/huYrkdeISK#ETNEverywhere #SouthAfrica #Electroneum #Airtime #Topup #ETN #Crypto #cryptocurrency pic.twitter.com/837urEr0Il— electroneum (@electroneum) August 12, 2019
Current Statistics of Electroneum:
ETN price is trading at 0.00000040 BTC at 02:10 UTC on 13th August 2019. The other essentials are as follows:
- Return on Investment: -95.19%
- Total supply/Circulating Supply: 9,771,003,760 ETN/ 9,771,003,760 ETN
- 24 Hour Volume: 143,407 USD
- Market Cap Value: 44,332,934 USD
- 7 Day high/low: 0.005295 USD / 0.004366 USD
ETN to BTC Price Comparison:

Advertisement
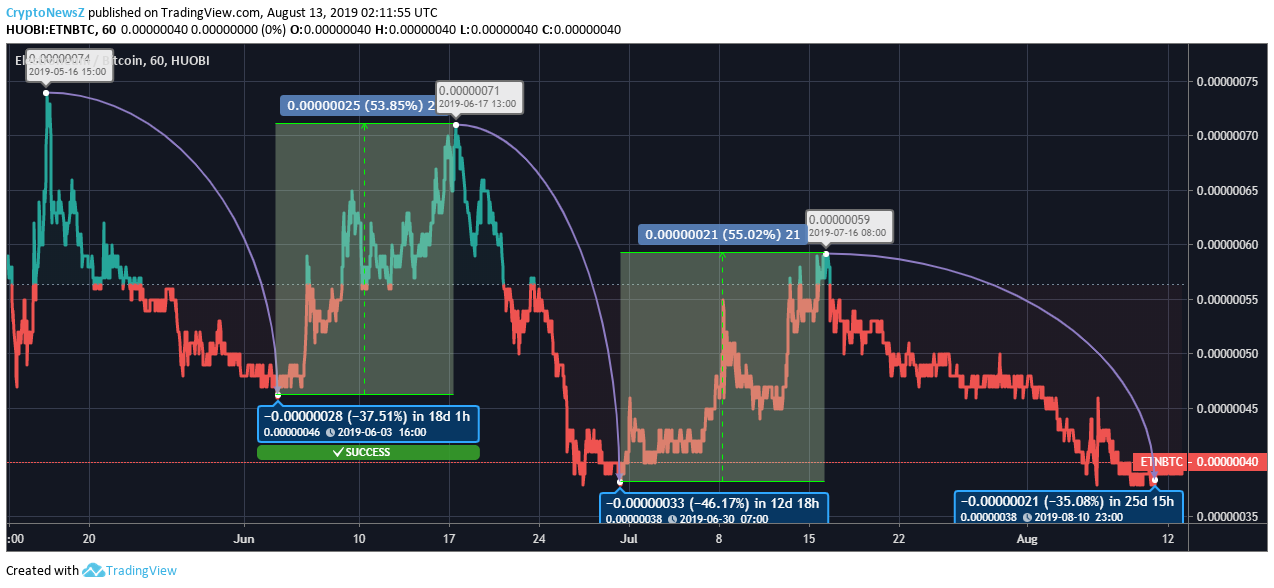
In the last 3 months, Electroneum price was initially seen trading above the baseline at 0.00000074 BTC price on 16th May at 15:00 UTC. ETN price then dropped by 37.51% on 3rd June at 16:00 UTC with the trading value of 0.00000046 BTC. The value increased by 53.85% by 17th June at 13:00 UTC with the trading value of 0.00000071 BTC. The price of Electroneum then dropped by 46.17% on 30th June at 07:00 UTC value trading at 0.00000038 BTC.
Electroneum price increased by 55.02% on 16th July at 08:00 UTC with the trading value of 0.00000059 BTC. The value then dropped by 35.08% on 10th August at 23:00 UTC with the trading value of 0.00000038 BTC.
Electroneum Price Prediction and Conclusion:
Advertisement
ETN coin is fluctuating in the buy zone as of now. So, for the new entrants, this may be a decent time for them to jump in Electroneum. For safer trading, you should consider the calculated resistance and support levels, which are as follows:
Resistance Levels:
- R3: $0.004748
- R2: $0.004677
- R1: $0.004607
Support Levels:
- S1: $0.004466
- S2: $0.004395
- S3: $0.004325


