After certain visibility in Thailand, Electroneum doesn’t seem to have grabbed any big platforms or regions. However, ETN is being seen and analyzed by many crypto followers, but still, feel doubtful on the returns. ETN has a long way to go. However, it is difficult to say when that golden time will be realized.
ETN Price Analysis:
At 06:27 UTC, the value of ETN was trading at $0.004887 on 4th July 2019. The remaining statistics are as follows:

- Return on Investment: -94.83%
- 24 Hour Volume: 341,067 USD
- Market Cap: 47,373,999 USD
- Total supply/Circulating Supply: 9,706,809,704 ETN / 9,706,809,704 ETN
- 7 Day high/low: 0.005097 USD / 0.003903 USD
Electroneum Price Comparison:
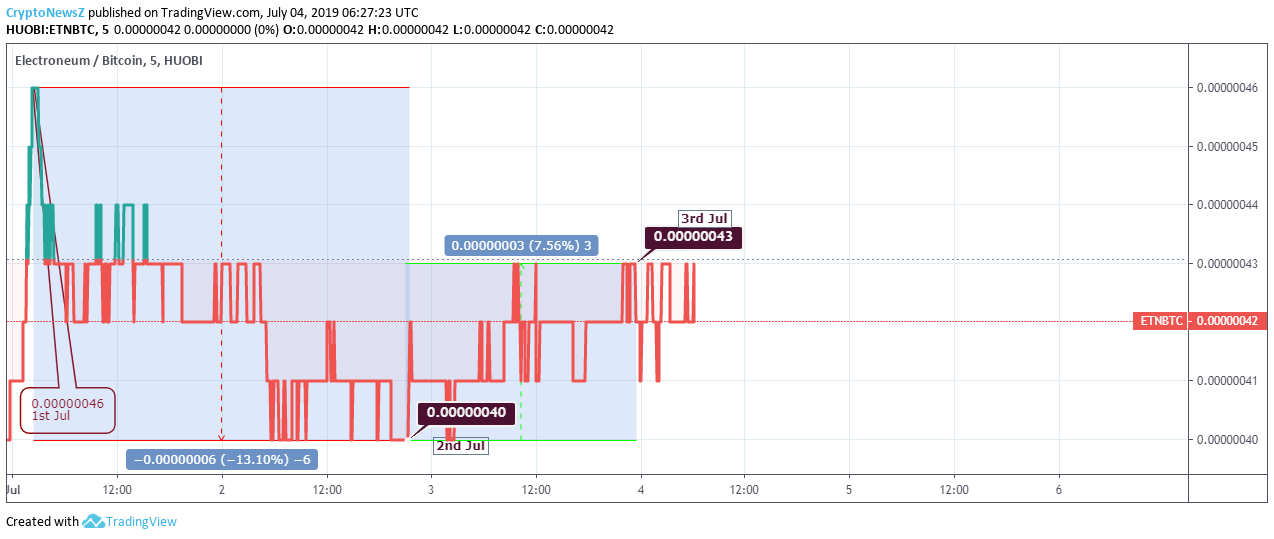
In the month of July, the highest trading value was realized on 1st July with 0.00000046 against BTC value. The lowest was then de-escalated the next day by 13.10% when the value was trading at 0.00000040 BTC on 2nd July.
Advertisement
However, the movement has been changed from then, since the value went upwards by 7.56% yesterday with a trading value of 0.00000043 BTC on 3rd July.
Electroneum Price Prediction and Conclusion:
Based on the last 30 days trend, ETN is trading in the bullish zone, which means traders can sell their coins to earn some returns. However, to continue the trade, you might bet under the safer zone, which is calculated as resistance and support level between $0.0052 and $0.0045.
Advertisement
In upcoming weeks, we might see the upside trading value to reach its major resistance level of $0.006, and if it fails to crack and if it moves downside, ETN might touch major support level at $0.0035 respectively.


