Electroneum (ETN) reflects a recovery in the intraday market. The coin is anticipated to have a great future in the coming time. The market is presently at $31 billion market cap. Yesterday, the coin slipped from $33 billion market cap to $31 billion. However, we are hopeful that the coin will regain its position in today’s market.
The intraday recovery has embarked in the coin. We are positive about the coin touching new highs in the coming days.
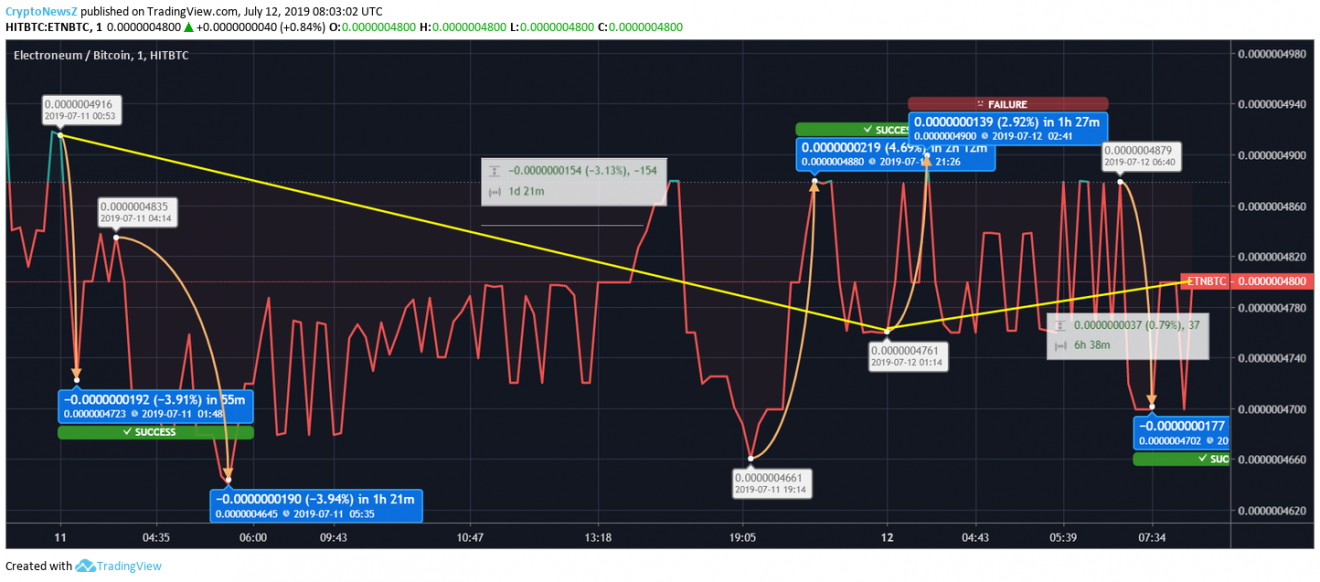
Let’s have a look at the intraday chart of Electroneum.
Electroneum (ETN) Current Statistics:
Advertisement
The price chart is taken from Trading View on 12th July 2019, at 08:03 UTC for price analysis.
Yesterday, the coin opened at 0.0000004916 BTC. The coin immediately slipped to 0.0000004723 BTC and registered loss of 3.91%. Later, the coin again fell from 0.0000004835 BTC to 0.0000004645 BTC by 3.94%. Towards the end of the day, the coin climbed from 0.0000004661 BTC to 0.0000004880 BTC by 4.69%. The coin closed at 0.0000004761 BTC. The intraday loss was of 3.1%. Today, the coin opened at 0.0000004761 BTC. The currency jumped from 0.0000004761 BTC to 0.0000004900 BTC by 2.92%. At 06:40 UTC the coin fell from 0.0000004879 BTC to 0.0000004702 BTC. The coin is currently dealing at 0.0000004800 BTC. The intraday upsurge recorded is of 0.79%.
ETN Price Summary:
- The ETN coin price is 0.005605 USD.
- Tron is the 109th coin in the crypto market.
- The 24hr volume of Electroneum (ETN) is 272,763 USD.
- The circulating supply has 9,731,718,246 ETN.
- The market cap is at 54,548,170 USD.
- The ROI (Return on Investment) is marked as -94.06%.
Electroneum Price Prediction and Conclusion:
The coming period in Electroneum is anticipated to be flourishing.
By the end of 2019, Electroneum is assumed to touch 0.0000007 BTC by the end of 2019.
Advertisement
The long term investment will give the best result. The traders of the said period will be seen drawing a huge dividend.


