With Brazil expansion in the picture, ETN might be able to improve their ranking and number of suppliers and users in the network. Let’s hope that ETN can switch to a strong bullish zone soon!
— electroneum (@electroneum) August 7, 2019
Current Statistics of Electroneum:
ETN price is recently seen trading at $0.004751 at 02:08 UTC on 8th August 2019. The other essentials are as follows:
- Return on Investment: -94.97%
- Total supply/Circulating Supply: 9,764,868,728 ETN/ 9,764,868,728 ETN
- 24 Hour Volume: 212,733 USD
- Market Cap: 46,392,689 USD
- 7 Day high/low: 0.005295 USD / 0.004495 USD
ETN to BTC Price Comparison:

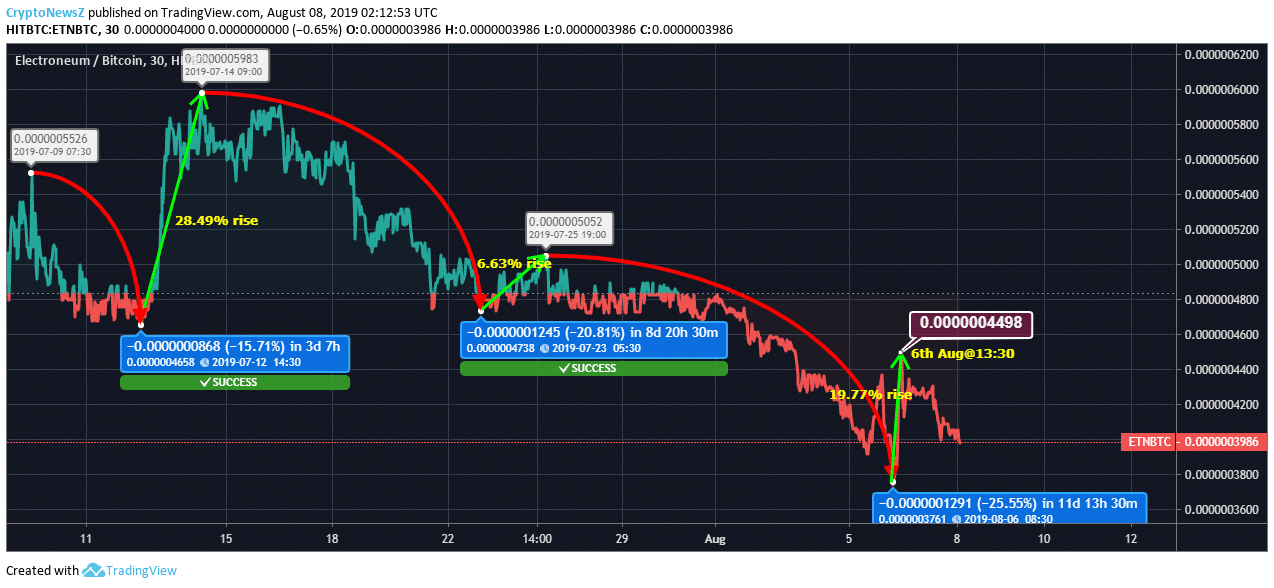
On 9th July, the value was initially trading at 0.0000005526 BTC value at 07:30 UTC. The value dropped by 15.71% by 14:30 UTC on 12th July. The value was seen escalating by 28.49% on 14th July at 09:00 UTC trading at 0.0000005983. The value saw a drop again by 20.81% on 23rd July at 05:30 UTC trading at 0.0000004783.
ETN price was slightly increased by 6.63% on 25th July at 19:00 UTC trading at 0.0000005052. The value saw a drastic drop after that by 25.55% on 8th August at 08:30 UTC trading at 0.0000003761. The value by 6th August was escalated by 19.77% at 13:30 UTC trading at 0.0000004498, which is dropped again as of now.
Electroneum Price Prediction and Conclusion:
ETN is as of late observed exchanging the bearish zone, which means new entrants purchasing Electroneum may be a decent exchange choice starting at now. Traders, be that as it may, might need to sit tight for some more opportunity to build a solid portfolio and appreciate the profits soon. Be that as it may, they can definitely choose their exchange venture under the resistance and support level of:
Resistance Levels:
Advertisement
R3: 0.0053
R2: 0.005166
R1: 0.004997
Support Levels:
S1: 0.004694
S2: 0.00456
Advertisement
S3: 0.004391


