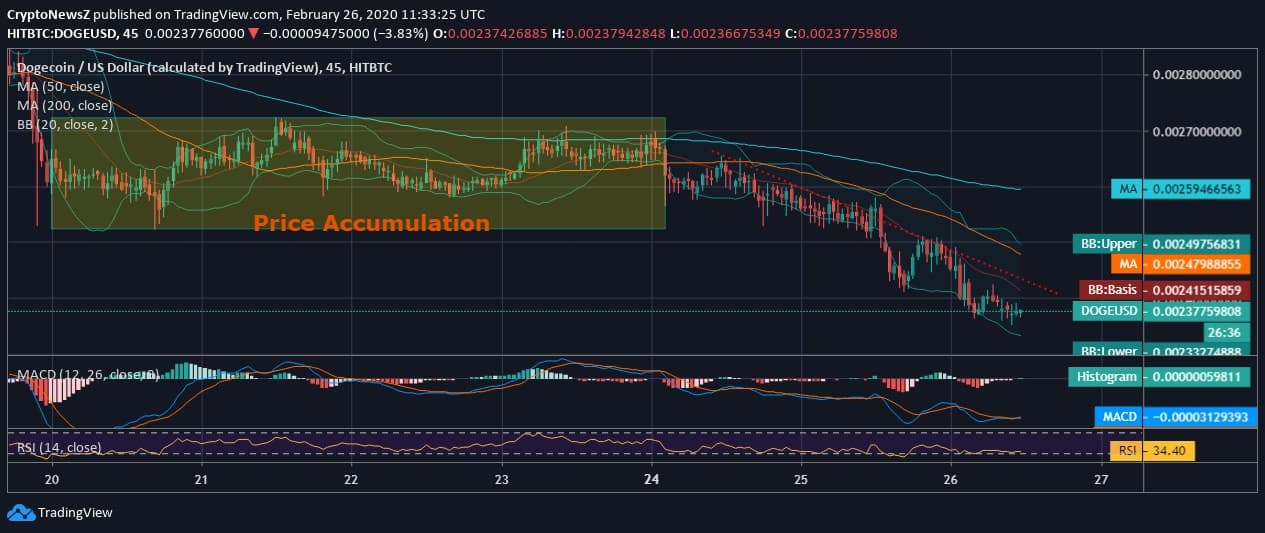
- Dogecoin, at the time of penning down this article, was trading at $0.00237 and is experiencing a freefall over the past two days after price accumulation
- DOGE price against US Dollar kept accumulating with the price range of $0.0026 and $0.0027, with a few instances above and below the said zone
- The intraday trading lures no gains as the counters turn red, and the coin lacks steady support from the daily moving averages
- The 20-day Bollinger Bands do not project about any vulnerable volatility in the upcoming days
Dogecoin (DOGE) forms a downtrend as the price nosedives notably, and tests support at $0.0023 price area. The intraday appears bearish as the coin lacks momentum and support.
Dogecoin Price Analysis
Taking a glance at the intraday DOGE/USD price movement on HitBTC, we see that the coin is facing a strong pullback after the price accumulation. The price trend of DOGE is hitting through the lower 20-day Bollinger Band as the coin lacks support from the 50-day and 200-day Moving Average. However, we do not see any vulnerably volatile price movement in the upcoming days as the 20-day Bollinger Bands have a moderate width. But to know about its future price changes, just check on Dogecoin future predictions thoroughly to learn about any further downfall before.
Advertisement
Dogecoin is believed to have a concurrent motion with Bitcoin, and today, the price of BTC is also testing support at $9,100. A freefall below $9,000 is likely to take the coin to test support at $8,700, and that is when the price of all the major altcoins may also dump.
Technical Indicators
The technical indicator laid shows a bearish crossover as the signal line of Dogecoin overrides the MACD line on the intraday chart.
Advertisement
The RSI of the coin is at 34.40 and is inclined towards the oversold region due to intraday correction and a downtrend that is forming recently.


