Dogecoin is a blockchain based peer-to-peer cryptocurrency and an altcoin that was designed to reach a much broader demographic than bitcoin. Dogecoin was introduced in the market as joke currency. It covered the shortcomings of Bitcoin, and other cryptocurrencies gained its fame with a whole online community sharing the currency and posting memes about it online. Dogecoin bounced 300% in value within the 72 hours of its introduction. Unfortunately, it lost most of its value with an online hack. However, the market boomed within a few days where it’s trading volume exceeded bitcoin briefly.
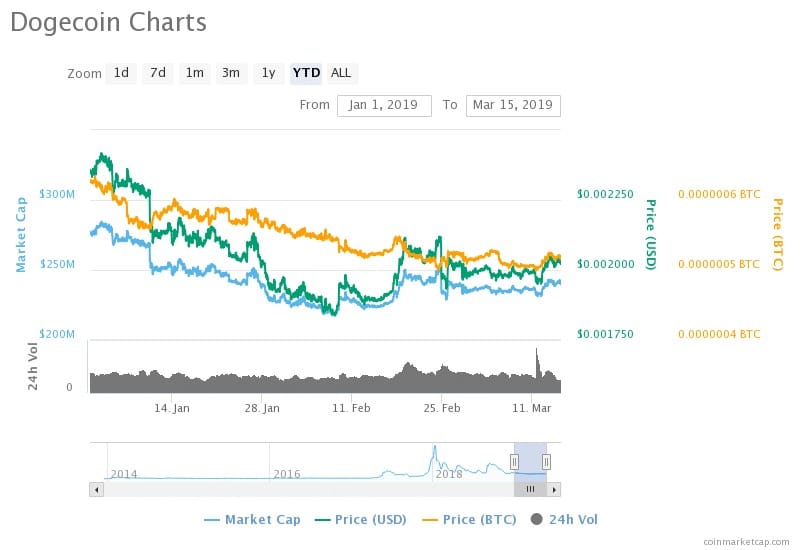
Dogecoin is the 28th largest cryptocurrency in the crypto market. According to the stats from CoinMarketCap, DOGE is trading with its MCap value of $240,443,203 USD for a 24h volume of $12,578,256 on March 15 at 10:14 UTC. This is based on the circulating supply of 118,654,589,130 DOGE coins. The Mcap value opened trading at 276 million USD at the beginning of January. On January 02, it reached a value crossing 284 million after which the market capsized. The market, on the whole, is unstable and has been majorly on the downtrend.
On February 08, the currency touched it were lowest of USD 217,425,630 and traded for USD 0.001840. It raised from its base and reached a high on February 24, where the MCap value exceeded 250 million USD and reached USD 250,788,573, which is 4.30% higher than the present day value. However, the market has been gradually increasing, and the current value is 10.59% higher than that its all-time low. The 20- day EMA also shows a downtrend with the dipping MCap value from $242,484,258 on February 23 to the current value. This exerts bearish pressure on the cryptocurrency’s market.
Advertisement
CoinMarketCap has also been observing the prices of USD and BTC along with the MCap values. The present prices of USD and BTC on March 15, 2019, at 10:14 UTC are $0.002026 and 0.00000052 respectively. Stats show that the price of BTC has taken the lead, followed by the MCap/USD pair. The price of BTC was high at the beginning of January with the value of 0.00000063 which is higher than the present day value by 21.15%.
However, the price of BTC was at its lowest with a value of 0.00000050 and has bounced up by 4% to reach the present-day value. Both the price of USD and the MCap value have been on the similar wave and merged at its lowest values on February 08 at 06:34 with MCap Value – $217,425,630 at the price of $0.001840 which is lower than the current price value by 10.11%. However, the values have started inclining moderately. The cryptocurrency reached its milestone with the price of USD shooting from USD 0.001911 on February 16 to USD 0.002116 on February 19, a 10.73% growth within 03 days.
Advertisement
The 14-day MA also exhibits an uptrend with Market Capitalization value increasing from March 01 to the current value by 1.93%. With both the moving averages moving in both direction and the bearish pressure on the market, the cryptocurrency’s balance is neutral and is not in favor of both long-term and short-term investments. Investors and traders should observe and explore further until the market shows a stable increase. Therefore, find more about the future price change details all in one place.


