Bitcoin is among the least volatile cryptocurrency as compared to others and gives an unsaid level of confidence. While others rely on their technology, upgrades, and upscaling abilities, BTC has become a digital gold with consistently higher values despite carrying no substantial weightage.
In the last few months, many countries have attempted to use bitcoin as a legal tender. This aligns with the end goal of replacing the fiat currencies with decentralizing cryptocurrencies but seems unlikely because of the higher controlling authority of the government around the financial domain. Bitcoin has a total liquidation of 89.64% at the time of writing this analysis.
Advertisement
On the other hand, Bitcoin has created new benchmarks with its increasing electricity consumption, which has become a massive issue for investors. However, since most countries still rely on fossil fuels for electricity production, BTC is not yet ready for the level of change initially envisioned by Satoshi Nakamoto.
Bitcoin Price Analysis
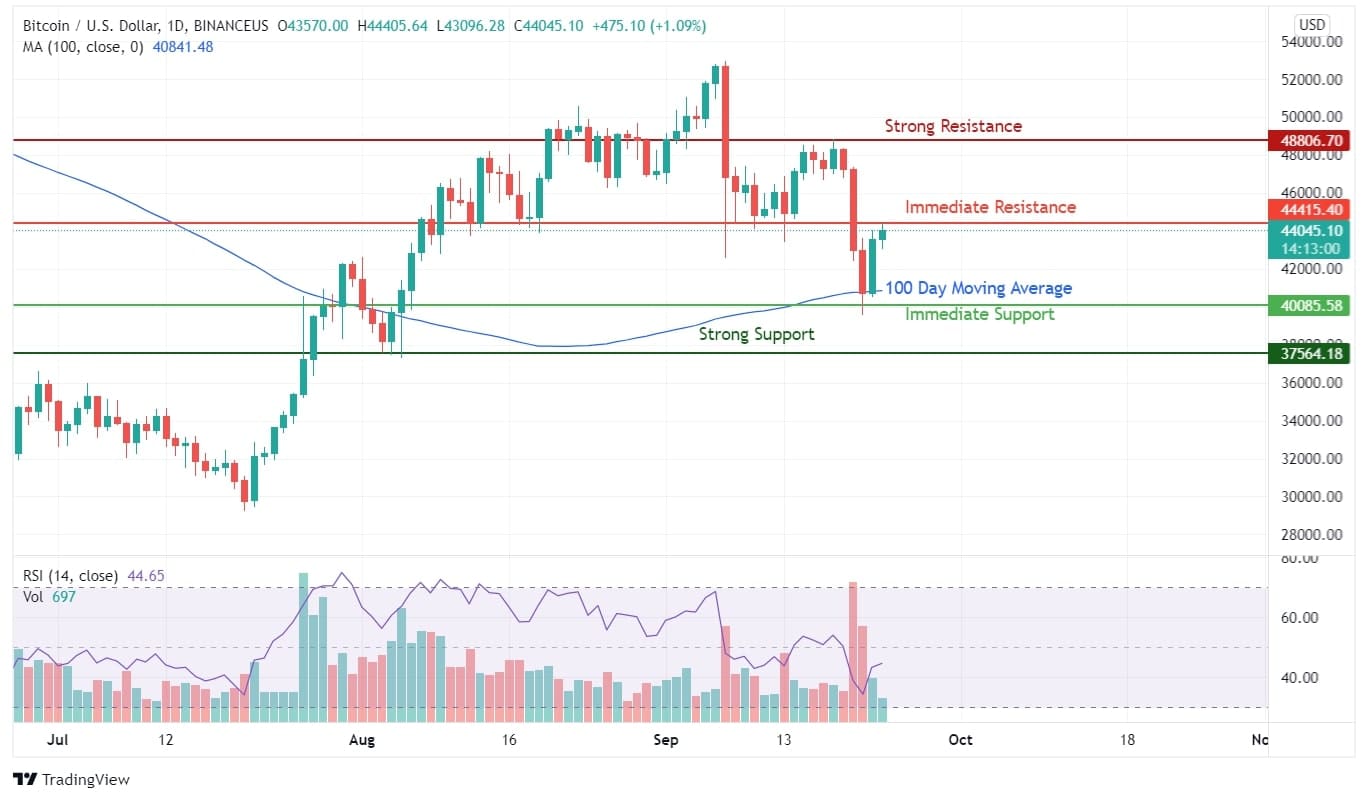
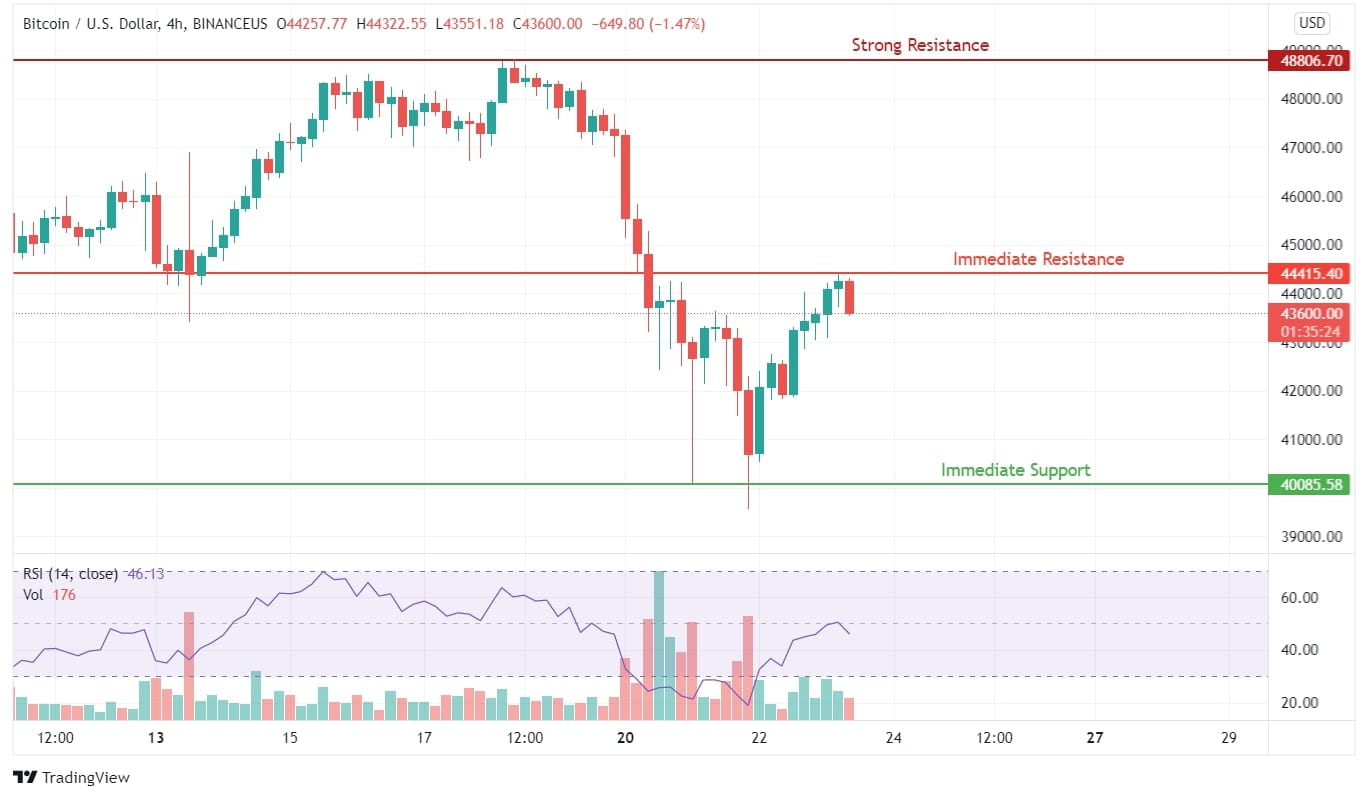
Sellers above $46000 and buyers at $40000, the price action of Bitcoin in the near term is in jeopardy. Not only does such price action adversely affect the momentum, but it has pushed away new investors.

Technical indicators such as RSI have taken a bounce from close to oversold and negative levels and are heading towards neutral levels. Failure to breach the immediate resistance level can initiate a fresh round of selling to retest the buying sentiment at the immediate support level. BTC volume on Monday and Tuesday (20th and 21st September) doubled the volumes witnessed on usual days. Thus, indicating a planned out selling action. As per our Bitcoin predictions, holders should keep holding and add more in case BTC drops towards $37,500.
Advertisement


